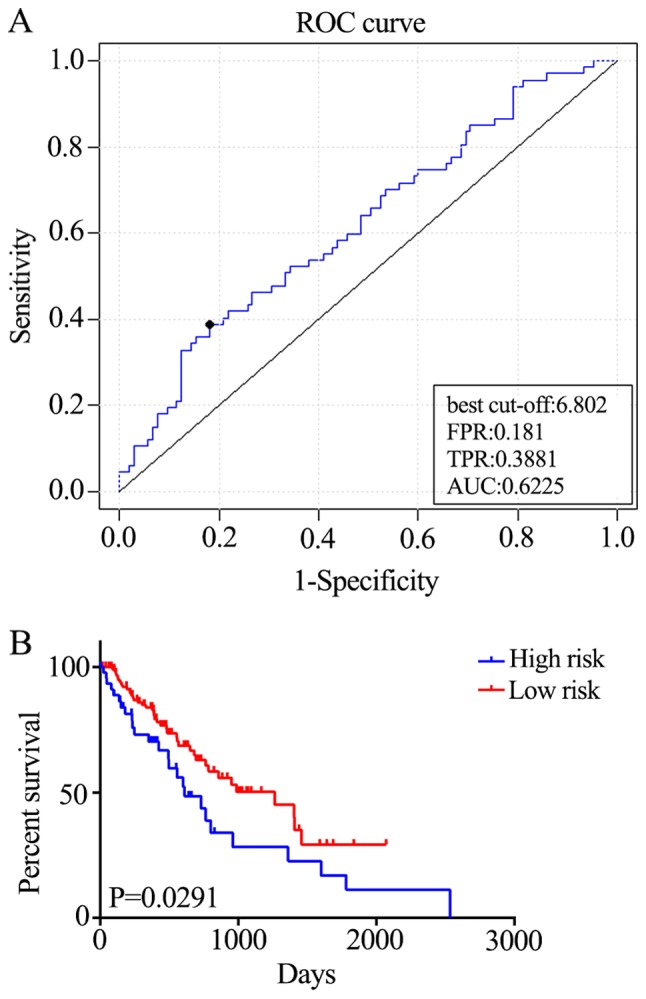
Figure 4.

Performance of the five-gene signature in predicting the overall survival of patients with esophageal squamous cell carcinoma. (A) The cross-validated time-dependent ROC curve was generated for survival predictions with an AUC of 0.6225. (B) Patients were divided into high- and low-risk groups by cross-validated Kaplan–Meier curve. ROC, receiver-operating curve; AUC, area under curve; FPR, false positive rate; TPR, true positive rate.
