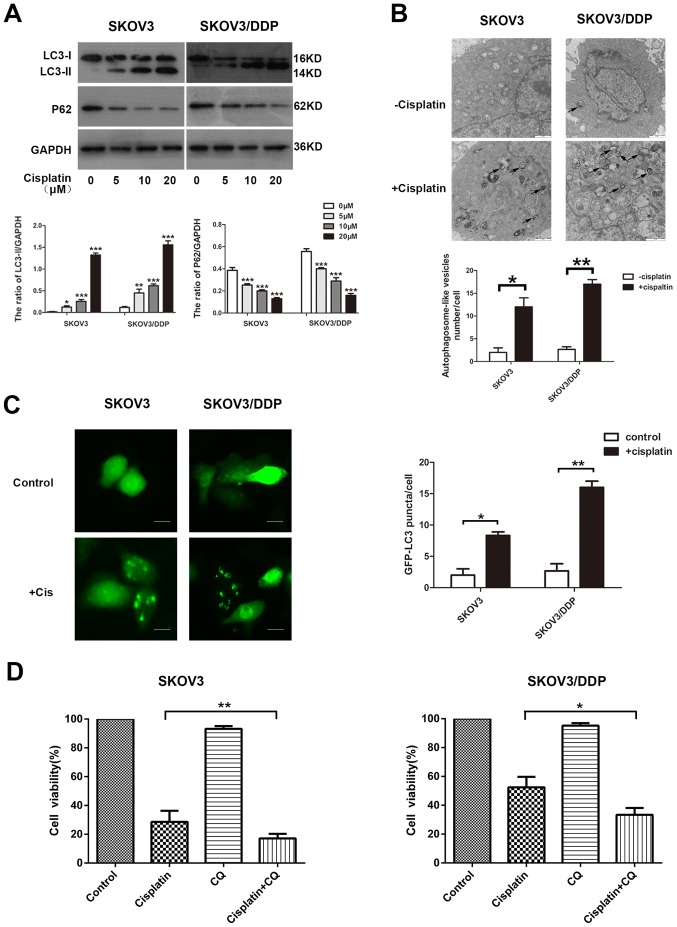
Figure 2.
Cisplatin induces cytoprotective autophagy in epithelial ovarian cancer cells. (A) Parental SKOV3 and cisplatin-resistant SKOV3/DDP cells were treated with the indicated concentrations of cisplatin for 48 h and whole-cell lysates were subjected to western blot analysis to detect the protein levels of LC3-I, LC3-II and p62. GAPDH served as a loading control. Densitometric values were quantified and the data are presented as the mean ± standard deviation of three independent experiments. *P<0.05, **P<0.01, ***P<0.001 vs. the control group. (B) Autophagic vacuoles were detected by transmission electron microscopy. The black arrows indicate autophagic vacuoles. Scale bar, 1 µm. *P<0.05 and **P<0.01. (C) SKOV3 and SKOV3/DDP cells were transiently transfected with a GFP-LC3 expression plasmid for 48 h and then exposed to cisplatin (20 µM) for an additional 48 h. The formation of GFP-LC3 puncta was examined using immunofluorescence and quantified. Each value represents the mean ± standard deviation from three independent experiments. Scale bar, 200 µm. *P<0.05 and **P<0.01. (D) SKOV3 and SKOV3/DDP cells were pretreated with or without CQ (10 µM) for 2 h and then exposed to the indicated concentrations of cisplatin for 48 h. The cell viability was determined using the Cell Counting Kit-8. The data are presented as the mean ± standard deviation from three independent experiments. *P<0.05 and **P<0.01. LC3, microtubule-associated protein 1 light chain 3; p62, sequestosome 1; GFP, green fluorescent protein; CQ, chloroquine disphosphate.

