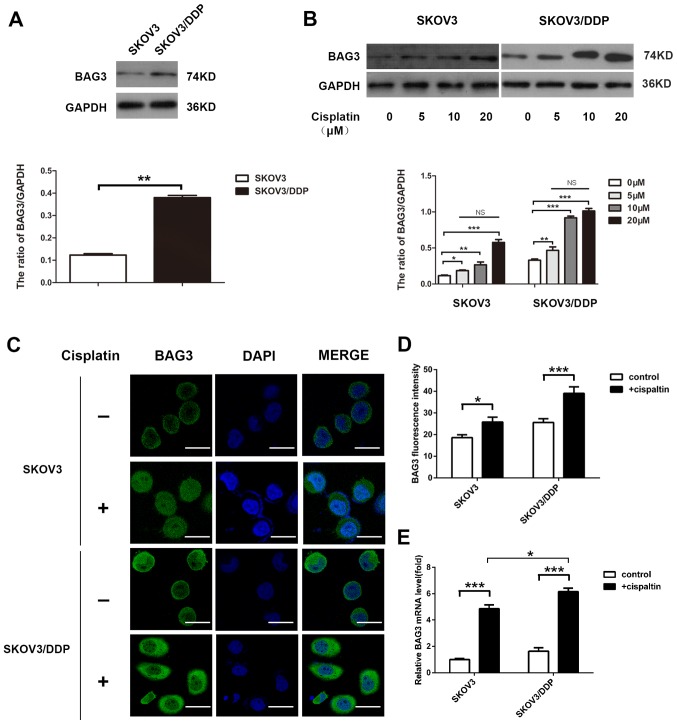
Figure 3.
Cisplatin promotes the expression of BAG3 in epithelial ovarian cancer cells. (A) SKOV3 and SKOV3/DDP cell lysates were subjected to western blot analysis to determine the endogenous expression level of BAG3 and GAPDH (as a loading control). **P<0.01. (B) SKOV3 and SKOV3/DDP cells were treated with different doses of cisplatin and whole-cell lysates were subjected to western blot analysis to detect BAG3 and GAPDH (as a loading control). Densitometric values were quantified and the data are presented as the mean ± standard deviation of three independent experiments. *P<0.05, **P<0.01 and ***P<0.001 vs. the control group respectively in SKOV3 and SKOV3/DDP. In addition, there are no statistically significant different during different treatment concentration groups respectively in SKOV3 and SKOV3/DDP. (C) SKOV3 and SKOV3/DDP cells were treated with or without 20 µM cisplatin for 48 h and BAG3 expression and location were detected using confocal microscopy. Scale bar, 50 µm. (D) Quantification of the relative fluorescence intensity. The data are presented as the mean ± standard deviation of triplicate determinations. *P<0.05 and ***P<0.001. (E) SKOV3 and SKOV3/DDP cells were treated with or without cisplatin (20 µM) for 48 h and BAG3 mRNA levels were then determined by RT-qPCR. The data are presented as the mean ± standard deviation from three independent experiments. ***P<0.001. BAG3, Bcl-2-associated athanogene 3; RT-qPCR, reverse transcription-quantitative polymerase chain reaction.

