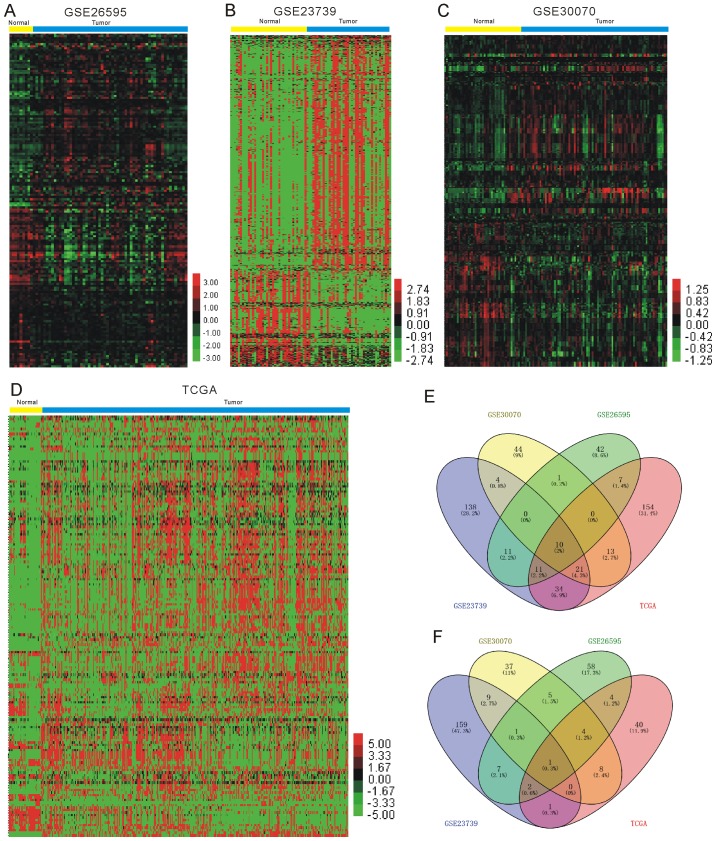
Figure 1.
Identification of the significantly differentially expressed miRNAs in gastric cancer. Heatmaps of the differentially expressed miRNAs in (A) GSE26595, (B) GSE23739, (C) GSE30070 and (D) TCGA data. Clustering analysis of the (E) upregulated miRNAs and (F) downregulated miRNAs in the four datasets. miRNA, microRNA; TCGA, The Cancer Genome Atlas.

