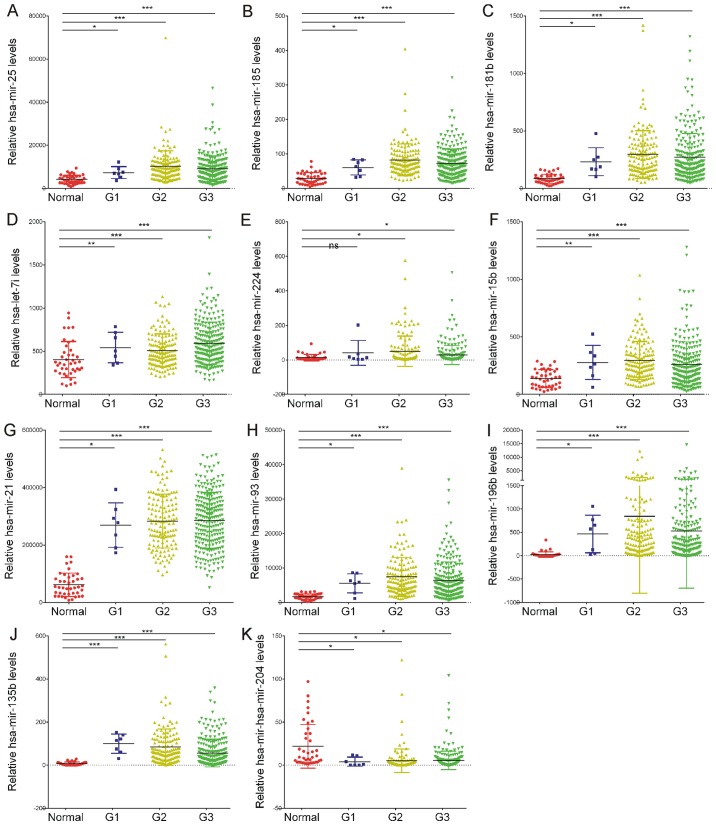
Figure 2.
Dot-plot assay for the expression levels of the 11 abnormally expressed miRNAs in G1, G2 and G3 gastric cancer tissues compared with the normal controls. (A) hsa-miR-25-3p, (B) hsa-miR-185-5p, (C) hsa-miR-181b-5p, (D) hsa-let-7i-5p, (E) hsa-miR-224-5p, (F) hsa-miR-15b-5p, (G) hsa-miR-21-5p, (H) hsa-miR-93-5p, (I) hsa-miR-196b-5p and (J) hsa-miR-135b-5p were identified to be significantly upregulated in G1, G2 and G3 gastric cancer tissues compared with the normal samples. (K) hsa-miR-204-5p was revealed to be downregulated in G1, G2 and G3 gastric cancer tissues compared with the normal samples. *P<0.05, **P<0.01, ***P<0.001. miRNA or miR, microRNA; G1, grade I; G2, grade II; G3, grade III.

