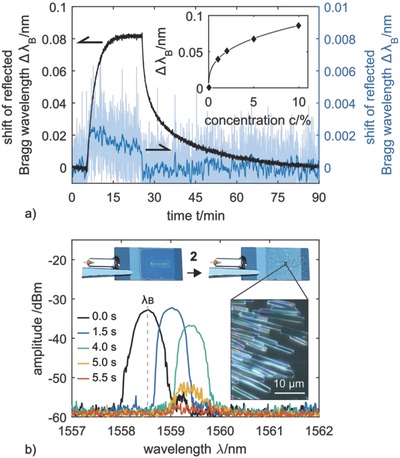
Figure 4.

a) Signal response (ΔλB) of a planar Bragg grating sensor coated with 1 (solid black line) and an identical but uncoated sensor (solid blue line) to a 2 exposition of 10 vol% in nitrogen. The inset shows the signal deflection of the coated sensor to various concentrations of 2 and the corresponding Langmuir–Freundlich fit. b) Shift of the reflected Bragg wavelength with signal drop‐off, due to crystallization. The images show the coated planar Bragg grating sensor prior and after exposure to 2. The microscopic image shows the crystallized sensor surface.
