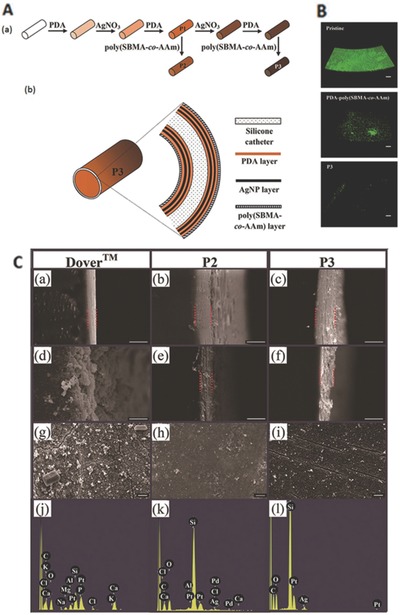
Figure 6.

A) Schematic diagram illustrating the (a) steps for modifying a silicone catheter surface and (b) structural layers of a P3‐coated catheter. B) Confocal laser scanning microscopy images (volume view) of a P. mirabilis biofilm on the intraluminal surface of pristine, PDA–poly(SBMA‐co‐AAm)‐,and P3‐coated catheter segments after incubation in culture medium containing 105 cells mL−1 for 24 h. Scale bars represent 100 mm. C) Scanning electron microscopy images of the (a–f) cross‐section of the intraluminal coating and (g–i) intraluminal surface; (a–c) before the encrustation test, (d, e, g, h) after 7 d of encrustation test, and (f and i) after 40 d of encrustation test; (j–l) energy dispersive X‐ray spectra of the surfaces shown in (g–i), respectively. (a, d, g, and j): Dover Ag‐coated catheter; (b, e, h, and k): P2‐coated catheter; and (c, f, i, and l): P3‐coated catheter. The Si signal from the silicone surface in the P2‐coated and P3‐coated catheters remained prominent unlike the Dover Ag‐coated catheter which showed strong Ca and P signals. Scale bars represent 10 mm. Reproduced with permission.92
