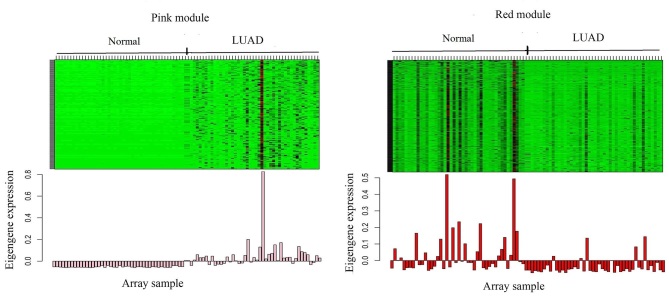
Figure 3.
Heatmap and expression level of ME in the pink and red module. The above heatmap shows the expression levels of all the genes in each module. The rows represent the genes in the module, and the columns represent 90 samples. The first 45 columns are normal samples, and the last 45 columns are LUAD samples. The corresponding histogram illustrates the expression level of the corresponding ME in each sample.

