Figure 4.

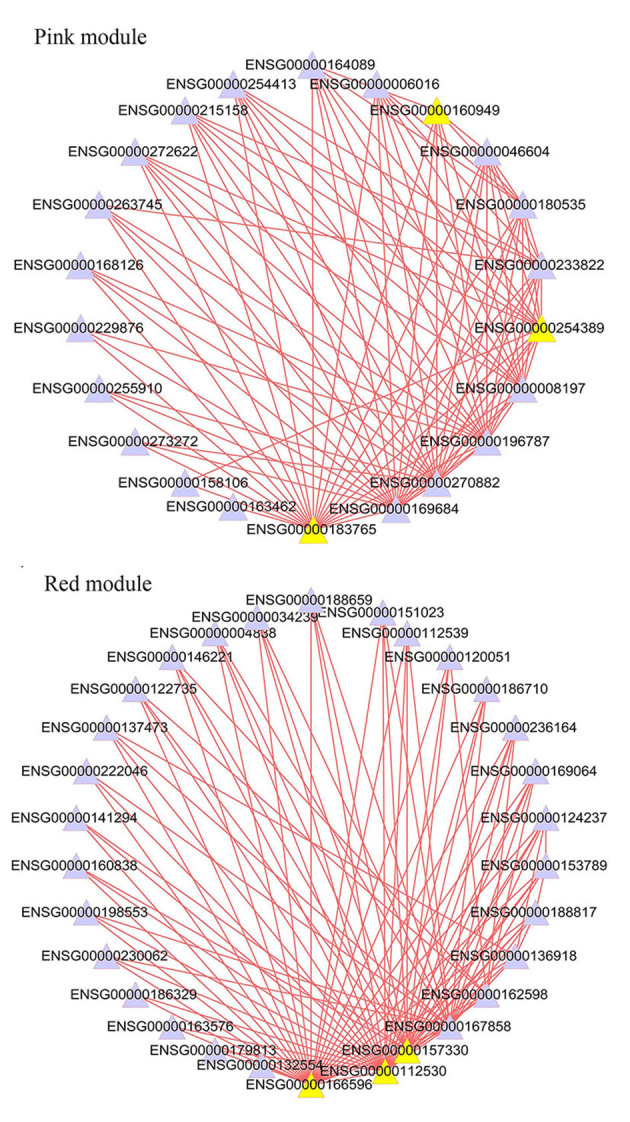
Network showing the top 100 strongest connections within the module. The yellow nodes represent the hub genes. The networks represent the pink and red modules, respectively.

Network showing the top 100 strongest connections within the module. The yellow nodes represent the hub genes. The networks represent the pink and red modules, respectively.