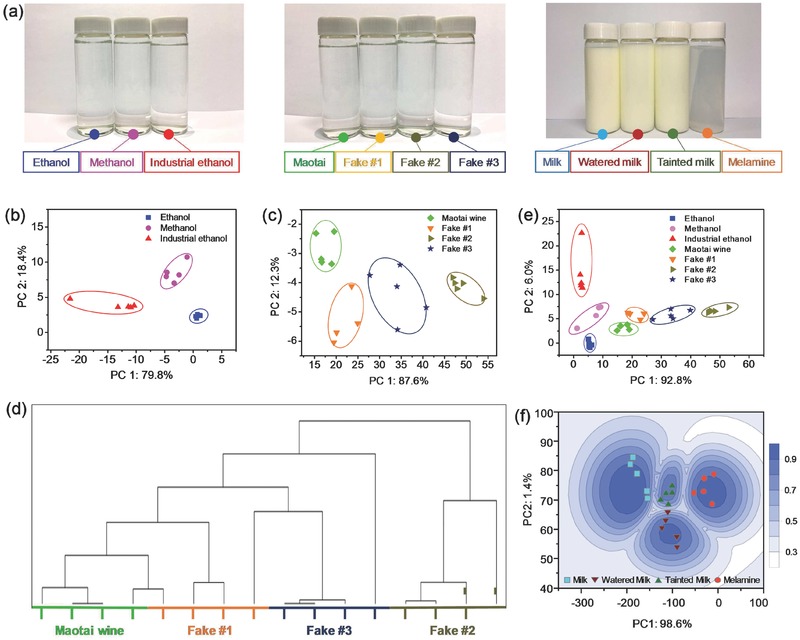
Figure 4.

Quality inspection with NCTPs. a) Photographs of tested liquids. PCA plots (calculated based on DataSet 1 in Table S1 in the Supporting Information) for b) ethanol, methanol, and industrial ethanol, c) Maotai wine, watered Maotai (Fake #1), and blended wine made from ethanol (Fake #2), and industrial ethanol (Fake #3). d) HCA plot. e) Genuine liquors identified based on the PCA results. f) Contour map of milks detection.
