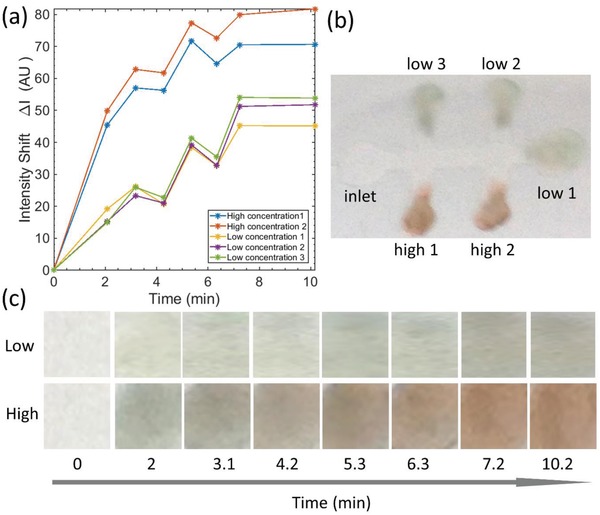
Figure 7.

A colorimetric glucose signal obtained from the demonstrator device. a) Glucose (10 × 10−3 m) signal as a function of time elapsed since the sample was applied. b) Snapshot of the colorimetric sensor at 7.2 min after sample application. c) Representative evolution of the spot color with high (3 g L−1) and low (0.75 g L−1) dye concentration.
