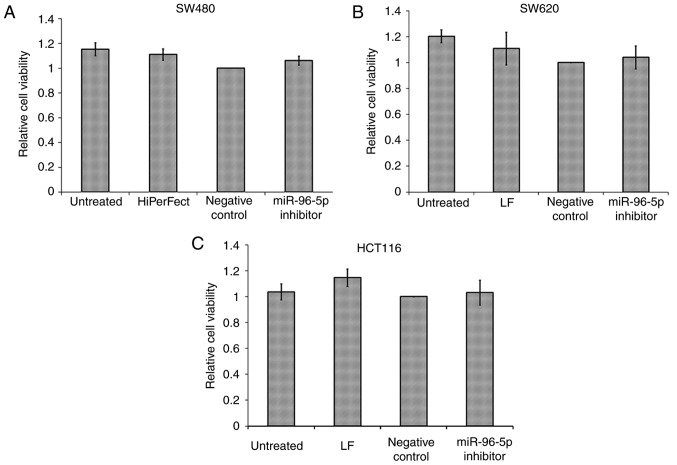
Figure 2.
Effects of miRNA-96-5p inhibitor on cell viability of (A) SW480, (B) SW620 and (C) HCT116. The values of cell viability were normalized with that of the corresponding negative control group. Untreated, only medium treated cells; LF, only Lipofectamine 2000 with medium treated cells; HiPerFect, only HiPerFect with medium treated cells; negative control, transfection with miR inhibitor control and cultured with medium; miR-96-5p, transfection with miR-96 inhibitor and cultured with medium. Data represent the mean ± SD of three independent experiments, each performed in triplicate.

