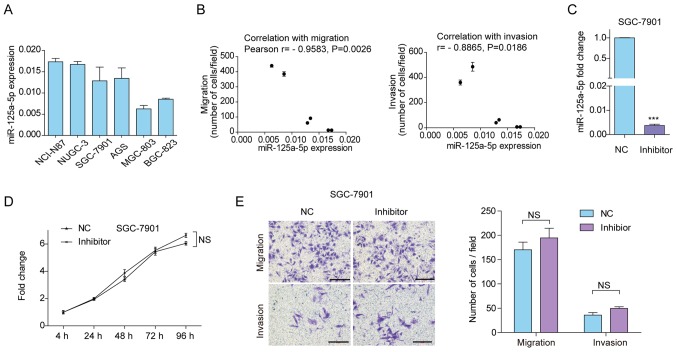
Figure 3.
Downregulation of miR-125a-5p expression in SGC-7901 cells. (A) Analysis of miR-125a-5p expression in six gastric carcinoma cell lines. (B) Scatter graph indicating the miR-125a-5p expression, migrated and invasive cell number of each cell line. (C) miR-125a-5p expression in SGC-7901 cells transfected with inhibitors or NC. ***P<0.001 vs. NC. (D) Analysis of cell proliferation using the Cell Counting Kit-8 assay. (E) Analysis of cell migration and invasion using the Transwell assay. Scale bar, 500 mm. Data are presented as the mean ± standard deviation. Three individual experiments with at least three replicates were performed. miR, microRNA; NC, negative control; NS, not significant.

