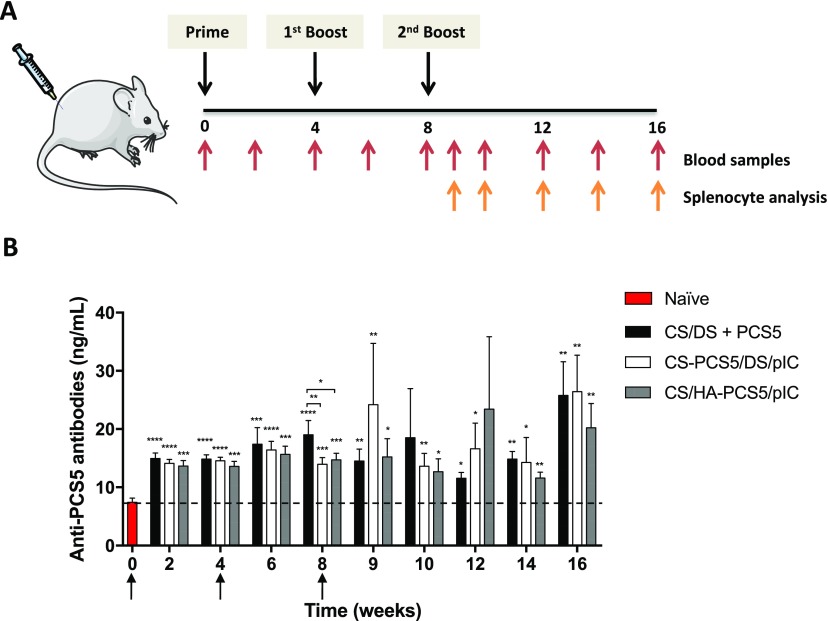
Figure 6.
In vivo studies in mice. (A) Schematic representation of the study design and timeline of the analysis. (B) Anti-PCS5 antibody levels after the intramuscular administration of the three nanoformulations CS/DS–PCS5 (black bars), CS–PCS5/DS/pIC (white bars), and CS/HA–PCS5/pIC (gray bars) to 50 mice per group. Values represent mean ± SEM (n ≥ 5). Statistical comparison between groups was done using a Mann–Whitney test. Significant statistical differences are represented as * (p < 0.05), ** (p < 0.01), *** (p < 0.001), and **** (p < 0.0001) for comparison between groups and to naïve mice. Mouse and syringe images in (A) were reproduced from Servier Medical Art under a Creative Commons Attribution 3.0 Unported License, https://creativecommons.org/licenses/by/3.0. Key: NPs, nanoparticles; CS, chitosan; DS, dextran sulfate; PCS5, protease cleavage site 5; pIC, poly(I:C) (polyinosinic:polycytidylic acid); HA, hyaluronic acid.

