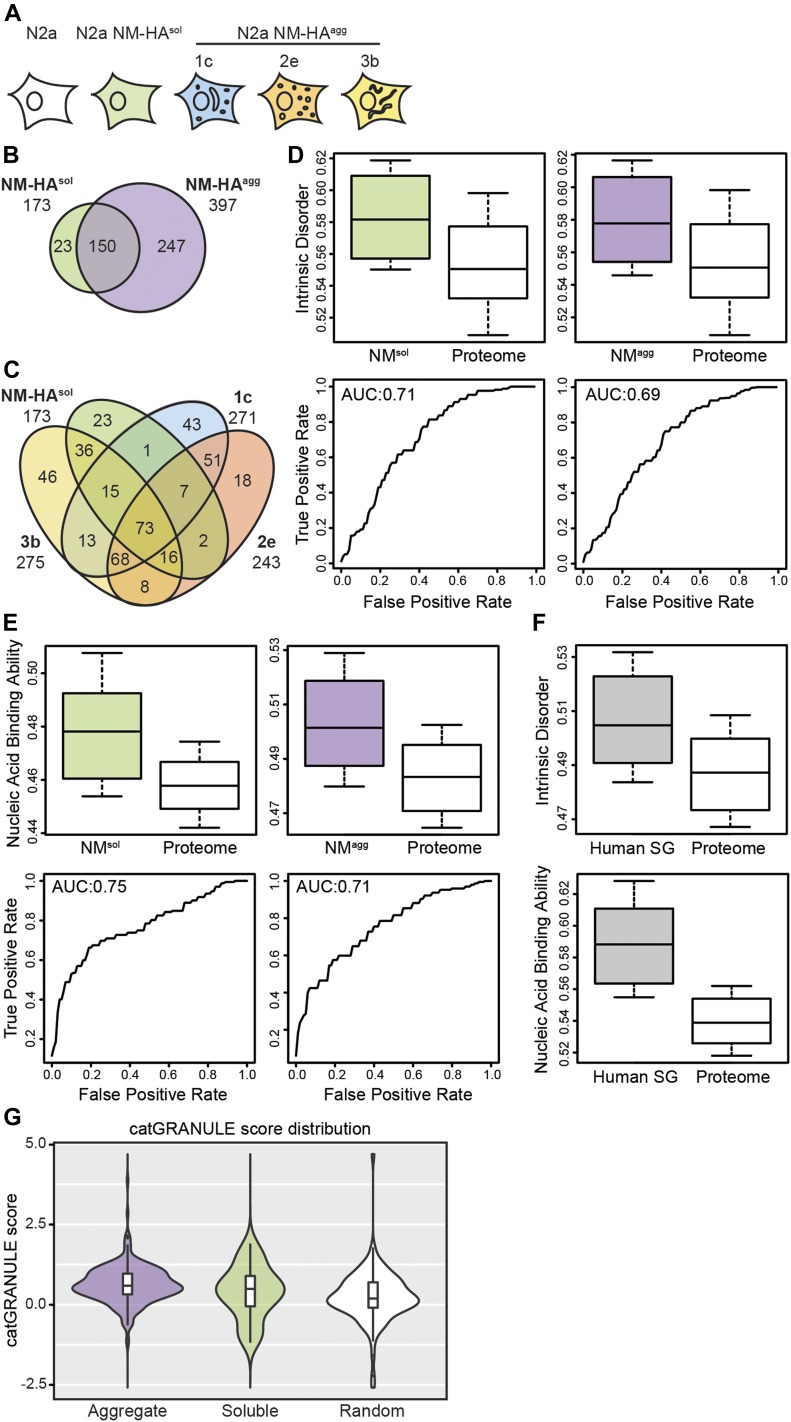
Figure 2. Interactomes of soluble and aggregated NM-HA are enriched for intrinsically disordered and nucleic acid–binding proteins.
(A) Analyzed cell lines. Biological triplicates of N2a subclones 1c, 2e, and 3b, N2a NM-HAsol and wild-type N2a cells were subjected to mass spectrometry analysis after SDS–PAGE and in-gel trypsin digestion of immunoprecipitated NM-HA using anti-HA antibodies. (B) Number of proteins found as putative interactors of soluble (NM-HAsol) and aggregated NM-HA (NM-HAagg) from cell clones 1c, 2e, and 3b combined. (C) Putative interactors of NM-HAsol and the NM-HAagg derived subclones 1c, 2e, and 3b individually. (D) Interactomes of soluble and aggregated NM-HA are enriched for intrinsically disordered proteins. Box-plot shows intrinsic protein disorder of interactors calculated using DisProt (Dunker et al, 2002). Intrinsic disorder of interactors was compared with that of a random subset of the mouse proteome. P-values are 1.7 × 10⁻⁸ and 3.48 × 10⁻⁹, respectively. Statistics were performed using the Kolmogorov–Smirnov test. Shown below is the corresponding area under the ROC curve (AUROC). (E) Interactomes of soluble and aggregated NM-HA are enriched for nucleic binding proteins. Box-plot displays the nucleic acid binding ability of interactors calculated using the scale of nonclassical RBD (Castello et al, 2012) compared with that of a random subset of the mouse proteome. P-values are 3.30 × 10⁻¹³ and 3.46 × 10⁻¹¹, respectively (Kolmogorov–Smirnov test). Shown below is the AUROC. (F) Intrinsic disorder and increased nucleic binding ability are characteristics of SG proteins. Box-plot shows intrinsic protein disorder calculated (upper panel) using DisProt (Dunker et al, 2002) and nucleic acid binding ability (lower panel) calculated using the Castello scale (Castello et al, 2012) for SGs components compared with a random subset of the human proteome. (G) Interactors of NM-HAagg have a higher propensity to assemble into cytoplasmic granules compared with a random subset of the mouse proteome (Bolognesi et al, 2016). Interactors NM-HAsol versus NM-HAagg: P = 0.2973; NM-HAsol versus random proteome: P = 0.2101; NM-HAagg versus random proteome: P = 2.348 × 10⁻⁷. Statistics were performed using the Wilcoxon test.

