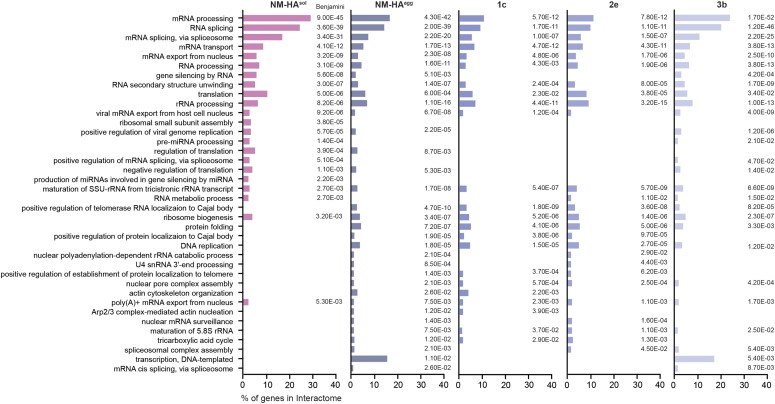
Figure 3. Gene Ontology enrichment analysis of NM-HA interactomes.
For all interactomes, the top 20 Gene Ontology biological process annotations were determined and combined in one list. Depicted are the percentages of genes that fall into this category compared with the respective interactome. Benjamini P-value is shown.

