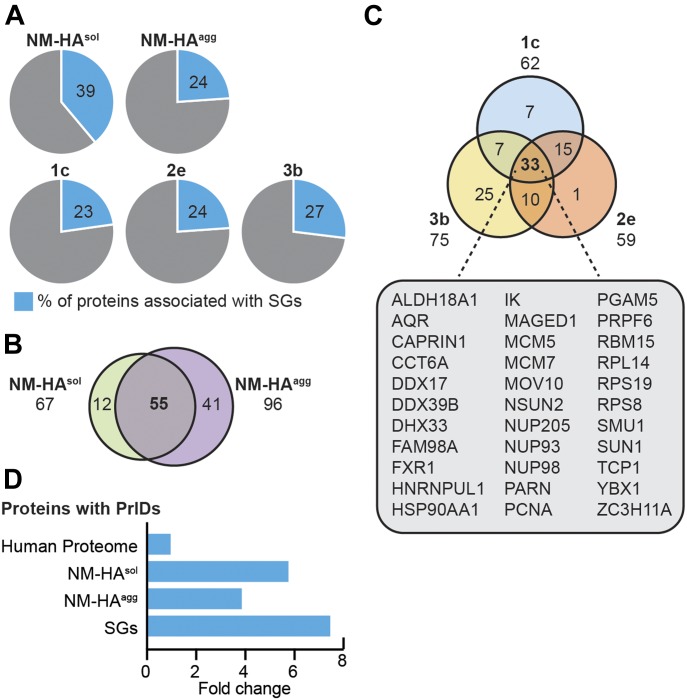
Figure 4. Comparison of SGs and NM-HA interactomes.
(A) Number of SG-associated proteins identified in the NM-HA interactomes. Interactomes were compared with a list of SG interactors curated from literature (Table S1) (Jain et al, 2016; Markmiller et al, 2018). Shown is the percentage of NM-HA interacting proteins that have been reported to be SG components. (B) Number of SG components interacting with both NM-HAsol and NM-HAagg. (C) Number of SG components associated with NM-HAagg in individual subclones 1c, 2e, and 3b (Table S1). (D) Enrichment of proteins with PrlDs in NM-HAsol, NM-HAagg, and SG interactomes (Table S1) compared with the human proteome (in fold change).

