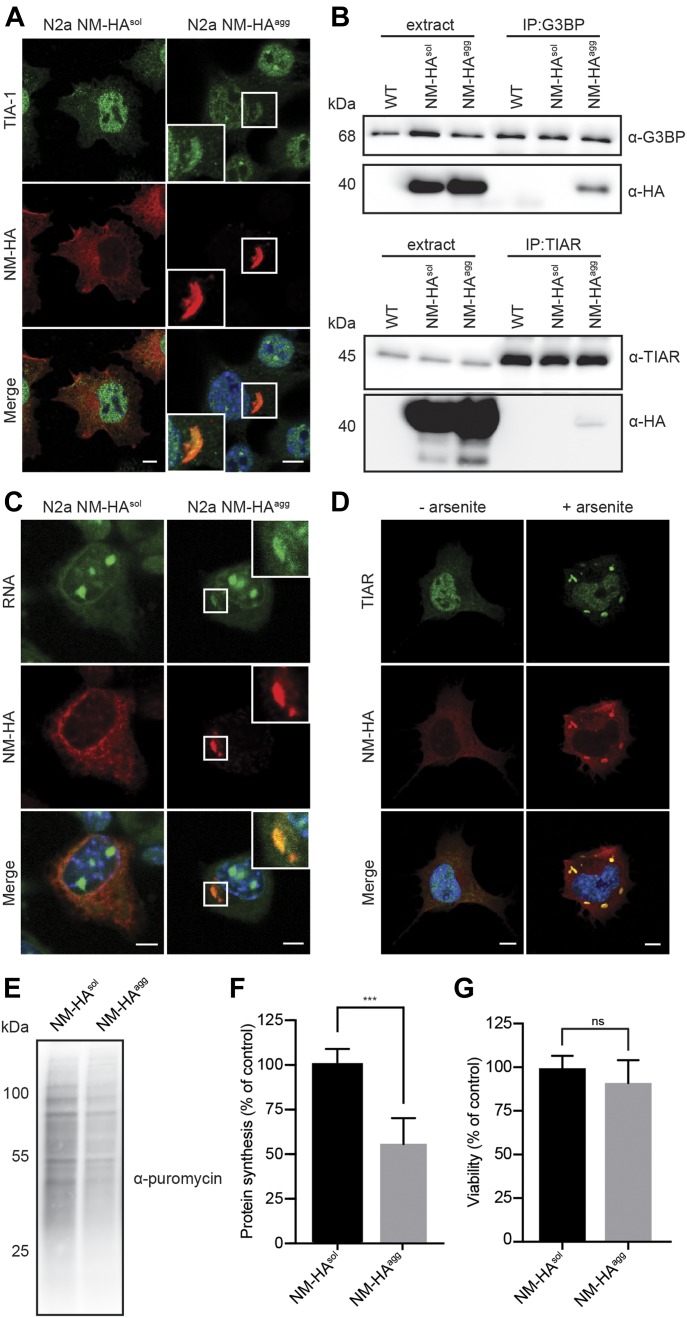
Figure 5. Shared components of NM-HA prions and SGs.
(A) Immunofluorescence staining of N2a NM-HAsol and N2a NM-HAagg bulk cells. NM-HA was detected using mAb anti-HA (red) and SG marker TIA-1 was detected using pAb anti-TIA-1 (green). Nuclei were stained with Hoechst (blue). Scale bar: 5 μm. (B) IP of G3BP and TIAR from lysates of wild-type N2a, N2a NM-HAsol, and N2a NM-HAagg bulk cells using mAb anti-G3BP or pAb anti-TIAR, followed by SDS–PAGE and Western blot. Total cell lysate (extract) was loaded as control. G3BP and TIAR were detected using mAb anti-G3BP and pAb anti-TIAR. NM-HA was detected using mAb anti-HA. (C) N2a NM-HAsol and N2a NM-HAagg cells were incubated with 1 μM SYTO RNASelect for 30 min and subsequently fixed with methanol, followed by immunofluorescence staining. NM was detected using mAb anti-HA (red), and RNA was visualized with SYTO RNASelect (green). Nuclei were stained with Hoechst (blue). Scale bar: 5 μm. (D) N2a NM-HAsol cells were treated with 0.5 mM sodium arsenite for 1 h to induce SGs or cells were left untreated. Immunofluorescence staining was performed using mAb anti-HA (red) and pAb anti-TIAR (green). Nuclei were stained with Hoechst (blue). Scale bar: 5 μm. (E) Protein synthesis was analyzed in N2a NM-HAsol and N2a NM-HAagg cells using the SUnSET method (Schmidt et al, 2009). Cells were incubated with puromycin for 30 min. Incorporated puromycin was detected using mAb anti-puromycin (12D10). (F) Quantitative analysis of puromycin incorporation. Bars represent mean values ± SD. Statistical analysis was performed using t test (n = 3). Significant changes are indicated by asterisks (***P ≤ 0.001). (G) Viability of N2a NM-HAsol cells and N2a NM-HAagg cells was determined by XTT tetrazolium salt assay. Bars represent mean values ± SD. Statistical analysis was performed using t test (n = 3). Changes are not significant (ns).
Source data are available for this figure.

