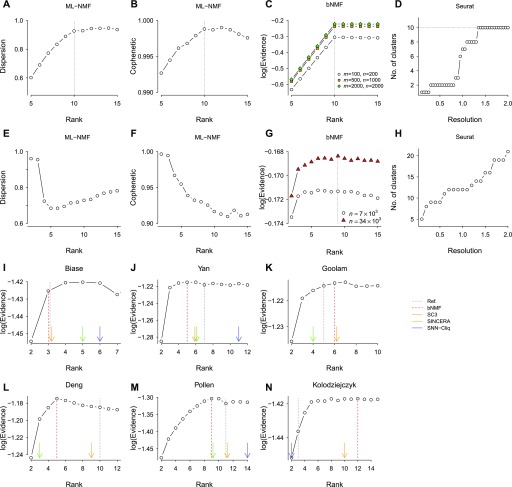
Figure 2. Comparison of optimal rank determination by NMF (ML-NMF and bNMF) and other clustering methods.
(A–D) Simulated data of 100 genes and 10 subgroups of cells (20 in each subgroup; 200 in total, except noted otherwise in (C)). ML-NMF narrows down the rank into an optimal range based on two quality measures, dispersion and cophenetic coefficient. (C) bNMF finds the correct rank 10 maximizing evidence. (D) Seurat (Macosko et al, 2015) requires specification of resolution parameter; the correct number of subgroups is reached as the upper bound with respect to resolution. (E, F) ML-NMF applied to PBMC single-cell data (Zheng et al, 2017). (G) bNMF applied to PBMC data sets of different sizes led to the optimal rank maximizing evidence as (H) PCA applied to PBMC yielded a wide range of subgroup numbers depending on resolution. (I–N) bNMF rank profiles and the number of clusters predicted by other computational algorithms applied to six gold standard data sets (Yan et al, 2013; Biase et al, 2014; Deng et al, 2014; Pollen et al, 2014; Kolodziejczyk et al, 2015; Goolam et al, 2016). The SC3 (Kiselev et al, 2017), SINCERA (Guo et al, 2015), and SNN-Cliq (Xu & Su, 2015) predictions are from Kiselev et al, 2017. The black dotted and red dashed lines are the number of major cell types expected from experimental design and the optimal rank from bNMF protocol, respectively. In (I), the total number of cells was small (n = 49) so that a large subset of factorization results in W matrices had uniform columns for r ≥ 4, implying ropt = 3.

