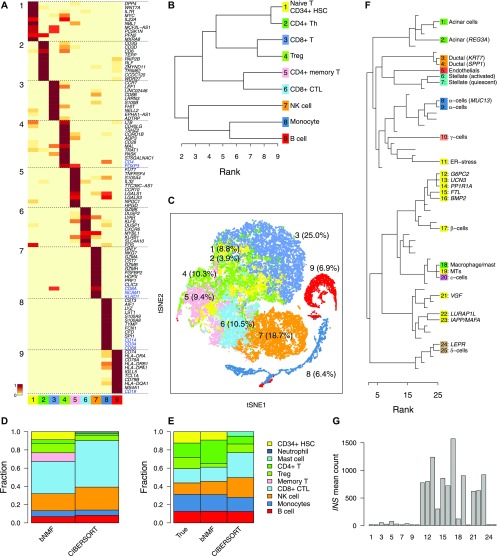
Figure 3. bNMF subgrouping results for PBMC and pancreas data sets.
(A–C) Results for the PBMC data set (n = 34,289). (A) Metagenes for subgroups derived from the factor matrix W under optimal rank 9 (Fig 2G). Heat map shows the relative magnitudes of matrix element Wik for each gene i and subgroup k, rescaled such that in each row, minimum and maximum correspond to 0 and 1. Up to 10 metagenes in addition to preselected markers per subgroup are shown. (B) Subgroup tree showing hierarchical relationships between subgroups under varying ranks from the lowest (2) to the optimal (9). Branching of a subgroup under a given rank into two under a successively larger rank was inferred by applying the majority rule (see the Materials and Methods section). (C) Visualization of subgroups with tSNE. Subgroup ID and composition of cells are indicated. (D, E) Comparison of cell type compositions predictedby bNMF and bulk data deconvolution method, CIBERSORT (Newman et al, 2015). Outcomes for the full fresh PBMC data and an example mixture of seven purified cell types are shown in (D) and (E), respectively. (F) Subgrouping of human pancreas cell data (Baron et al, 2016). Colors indicate major cell types. Insulin-producing β-cells are in yellow (see Figs S5 and S6 and Table S2). MT, metallothionein. (G) Mean RNA count of INS gene in each pancreas subgroup.

