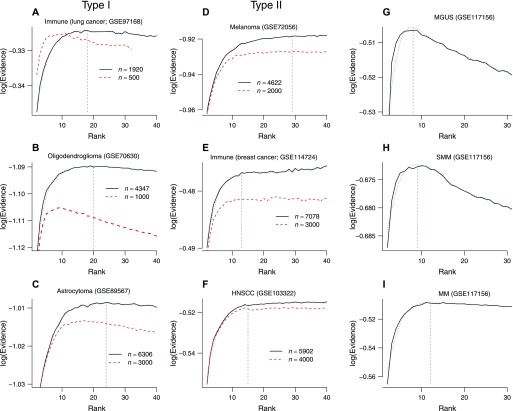
Figure 6. bNMF clustering outcomes for in vivo solid tumor and myeloma samples.
(A–F) Rank versus evidence profiles of data sets with accession numbers as indicated (Tirosh et al, 2016a, 2016b; Lavin et al, 2017; Puram et al, 2017; Venteicher et al, 2017; Azizi et al, 2018). Dotted blue lines are smooth-spline fits to data. Vertical dashed lines are locations of optimal rank. (G–I) Evidence profiles of MM samples in MGUS, SMM, and full MM stages (Ledergor et al, 2018).

