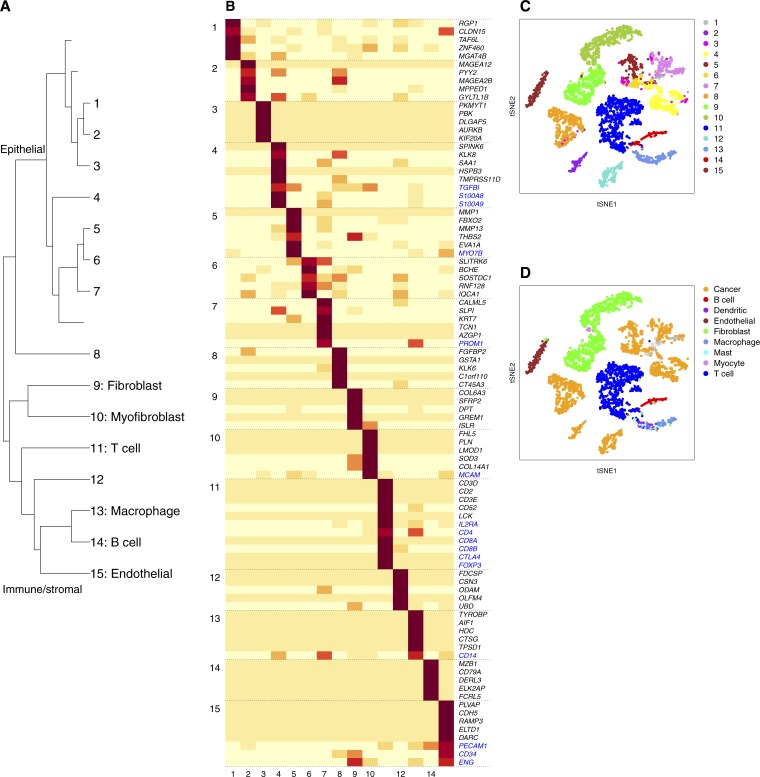
Figure S10. bNMF subgroups in head and neck cancer data set (Puram et al, 2017).
(A) Subgroup tree. (B) Metagene map (top five plus marker genes in blue) for 15 subgroups. (C) tSNE visualization of 15 subgroups. Numbers indicate subgroup labels in (A–B). (D) Cell-type annotation by Puram et al (2017).

