
Figure 5.
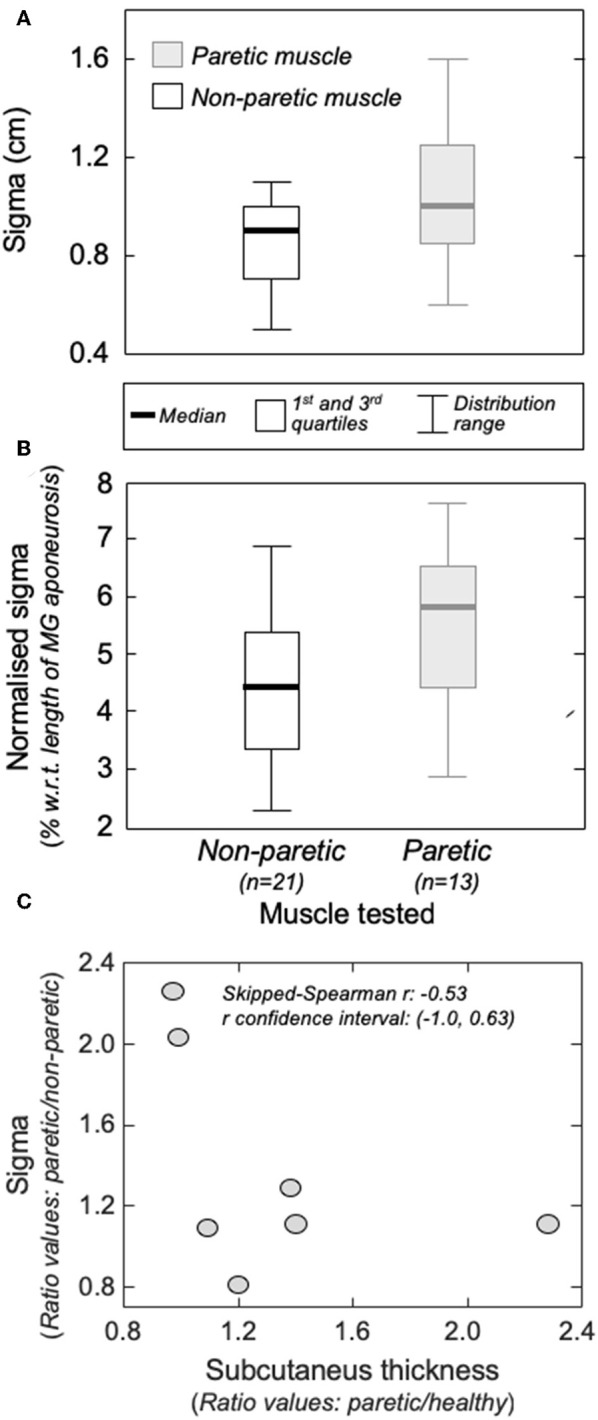
The amplitude distribution of surface, action potentials. (A) shows the standard deviation (sigma) of the Gaussian curves fitted to the RMS distribution of motor unit action potentials identified from the non-paretic (white boxes) and from the paretic (gray boxes) MG muscles. Sigma values normalized with respect to the length of the MG superficial aponeurosis (see Figure 1B) are shown in (B). Thick horizontal lines denote the median values. Boxes and whiskers correspond, respectively, to the interquartile interval and the range values. Ratios between sigma values obtained from the paretic and non-paretic MG (ordinate) and ratios between subcutaneous thickness values computed for the paretic and non-paretic limb (abscissa) are shown in (C). The skipped-Spearman correlation coefficient and its confidence interval (23) are shown within (C).