
Figure 2.
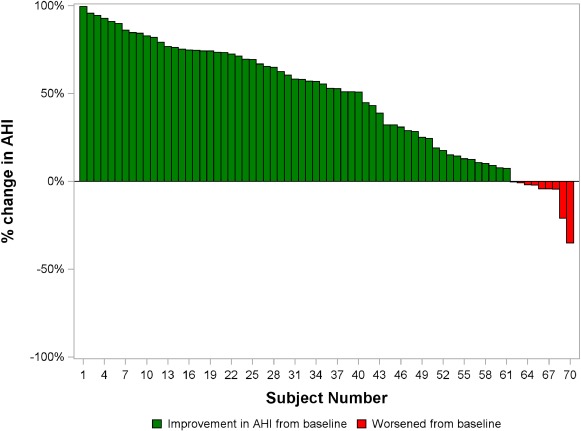
Percentage change in apnoea–hypopnoea index (AHI) from baseline to 12 months of therapy for each patient in the pooled population of patients with heart failure and polysomnogram data. The change from baseline following 12 months of active therapy for all subjects is shown. Patients with any decrease in AHI from baseline are shown in green bars and patients with any increase in AHI from baseline are shown in red bars.