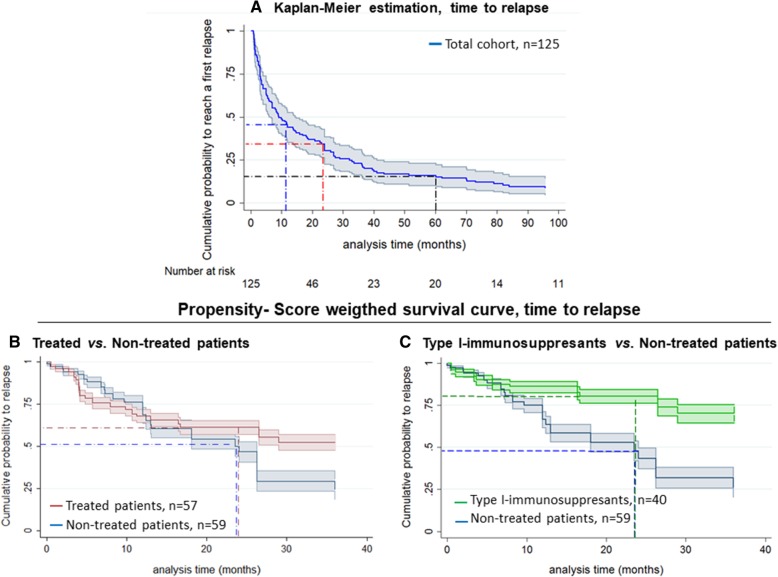
Fig. 3.
Kaplan-Meier analysis. a Time to relapse in the whole cohort; blue, red and black discontinuous lines represent the estimated probability of relapsing after 1, 2 and 5 years, respectively. The 95% confidence interval is shown in grey. b, c Propensity score weighted-survival curves, according to treatment. *The slight difference between the two analyses for the non-treated group is due to the different PS used for each model

