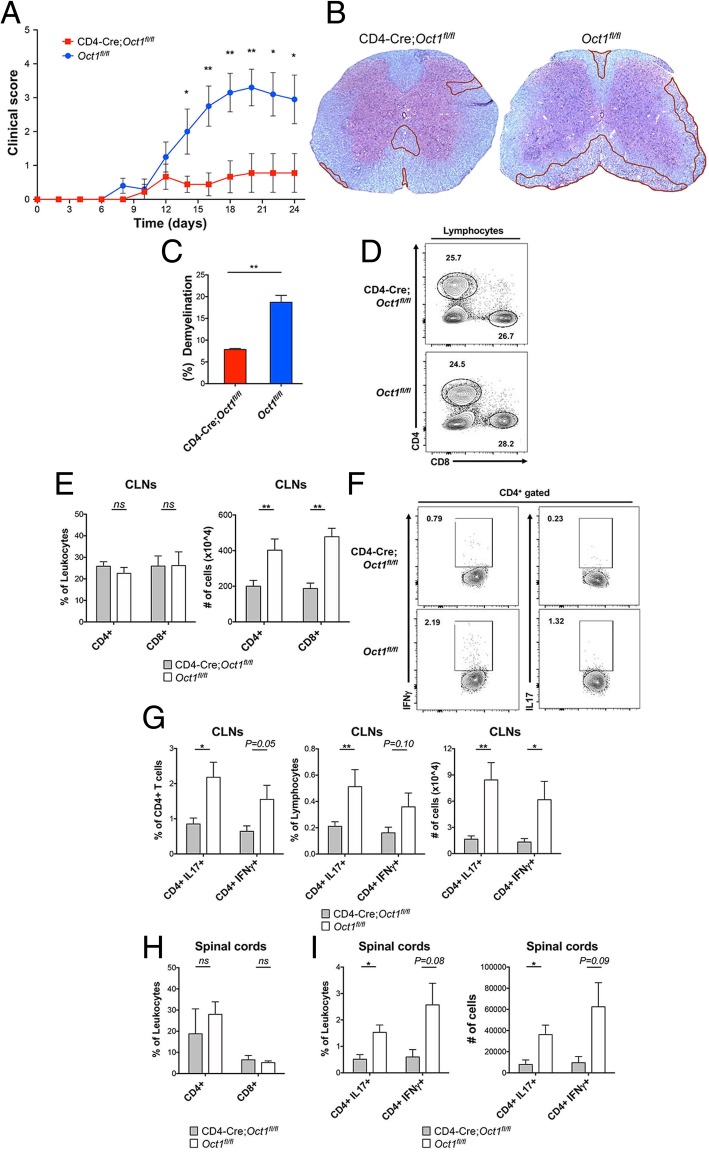
Fig. 1.
Loss of Oct1 in T cells protects mice using an EAE model of MS. a CD4-Cre;Oct1fl/fl (n = 9) or Oct1fl/fl (n = 10) mice were injected with MOG35–55 peptide and pertussis toxin to generate EAE. Clinical scores were determined during the post-treatment timecourse. b Representative LFB staining of thoracic spinal cord sections from animals taken at peak disease (day 21). Areas of demyelination are outlined in red. c Quantification of demyelination in experimental mice. Mean % demyelination from six sections of two mice. d Cervical lymph node lymphocytes were isolated from EAE-induced CD4-Cre;Oct1fl/fl (n = 6) or Oct1fl/fl (n = 6) mice and analyzed by flow cytometry. Frequencies of CD4 and CD8 cells from representative animals are shown. e Mean CD4+ and CD8+ T cell percentages (left panel) and total cell numbers (right panel). Cells were independently purified from the CLNs of six separate six mice. f Representative data showing frequencies of cytokine-producing CD4+ cells in the CLN. g Percentages (left and middle panels) or total cell numbers (right panel) of cytokine-producing CD4+ T cells are plotted. N = 6 for each group. Mean of results is shown. h Mean CD4+ and CD8+ T cell percentages in the spinal cords. N = 3–4 for each group. i Cytokine-producing CD4+ T cell percentages (left panel) and total cell numbers (right panel). Cells were independently purified from the spinal cords of separate six mice

