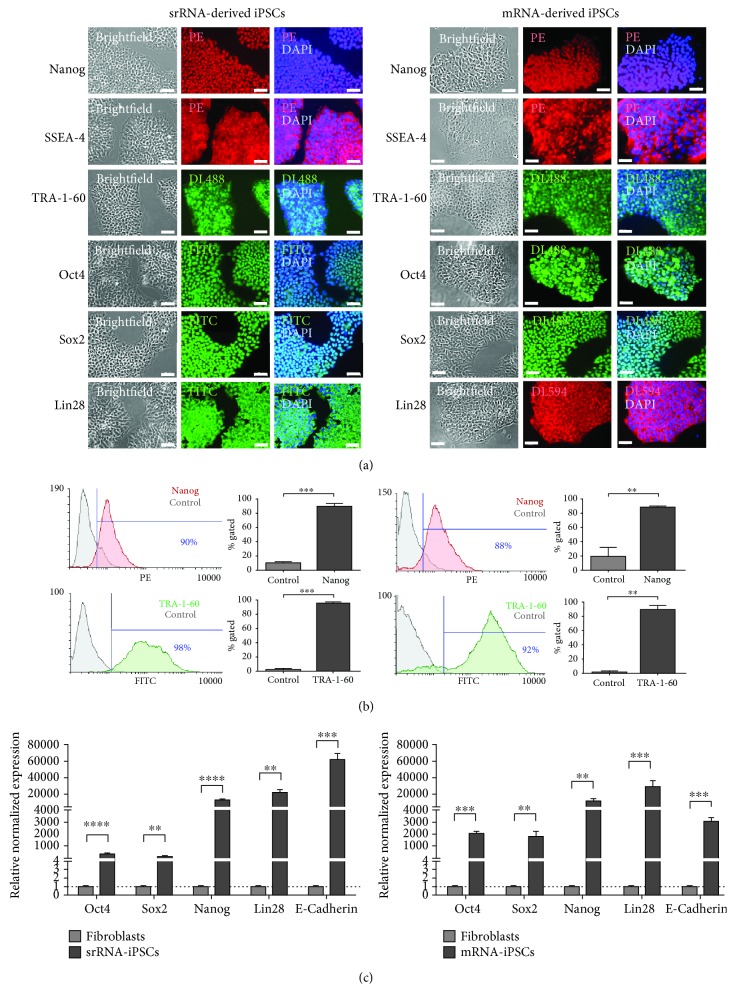
Figure 4.
Analysis of pluripotency markers in iPSCs generated by mRNA or srRNA delivery. (a) iPSCs stained with antibodies specific for pluripotent stem cell markers (Nanog, SSEA-4, TRA-1-60, Oct4, Sox2, and Lin28) showed a strong protein expression (n = 3). Scale bars represent 50 μm. (b) Analysis of Nanog and TRA-1-60 expression by flow cytometry. Data are shown as mean+SD (n = 3). Statistical differences were determined using a paired t-test (∗∗p < 0.01, ∗∗∗p < 0.001). (c) Analysis of Oct4, Sox2, Nanog, Lin28, and E-cadherin expression in iPSCs using qRT-PCR. mRNA levels were normalized to GAPDH mRNA levels, and the expression is presented relative to the expression levels in fibroblasts. Data are shown as mean+SEM (n = 3). Statistical differences were determined using a paired t-test (∗∗p < 0.01, ∗∗∗p < 0.001, and ∗∗∗∗p < 0.0001).

