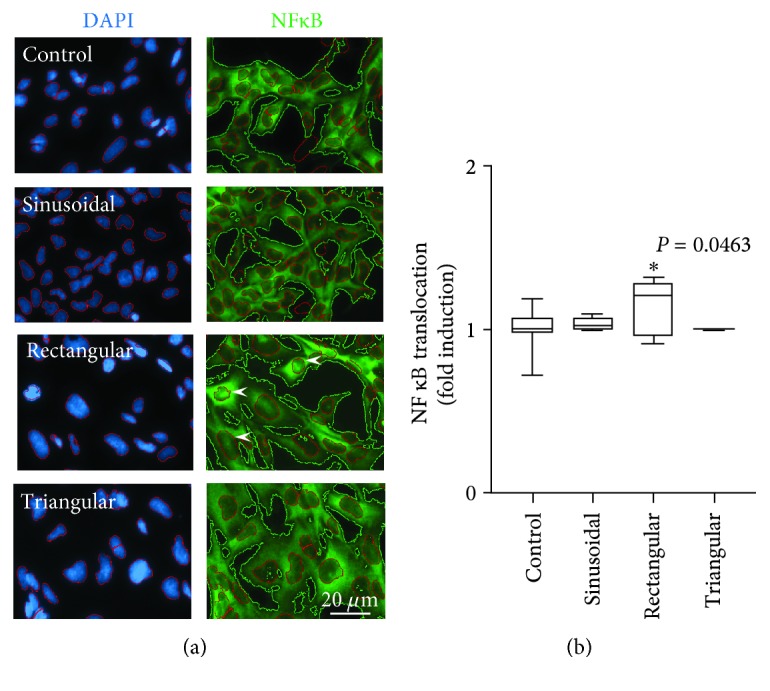
Figure 3.

Effect of cyclic stretch on nuclear NF-κB translocation. (a) Representative images of BEAS2B nonstimulated control cells (n = 18), cells subjected to sinusoidal (n = 6), rectangular (n = 6), or triangular (n = 6) cycling strain for 4 h. Left: nuclei visualized with DAPI (blue); right: NF-κB distribution (green). Arrowheads indicate nuclei with elevated NF-κB content. The scaling bar represents 20 μm. (b) Densitometric evaluation of the ratio of total (green contours) to nuclear (red contours) NF-κB signal. Box plots indicate median, upper/lower quartile, and bars with minimal/maximal values. Statistics: analysis of variance (Tukey's post hoc test). ∗ P = 0.0463 vs. control.
