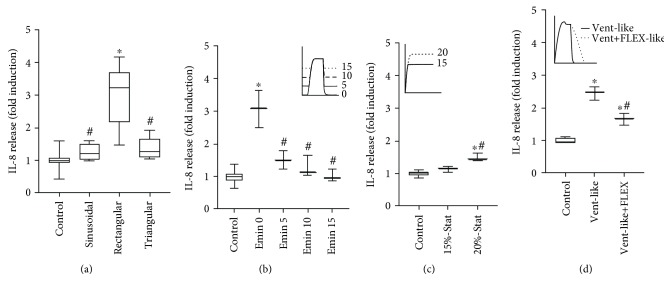
Figure 4.
Extracellular IL-8 levels. IL-8 ELISA readings in culture medium from BEAS2B cells. (a) Nonstimulated controls (n = 18) and cells subjected to sinusoidal (n = 6), rectangular (n = 6), or triangular (n = 6) cyclic strain for 4 h. ∗ P < 0.001 vs. control; # P < 0.001 vs. rectangular strain profile. (b) Nonstimulated controls (n = 12) and cells subjected to cyclic strain (n = 3) with 20% elongation maximum and elongation minimum (Emin) set to 0, 5, 10, or 15%, respectively. ∗ P < 0.001 vs. control; # P < 0.001 vs. Emin 0. (c) Nonstimulated controls (n = 6) and BEAS2B cells subjected to static strain (Stat; n = 3) of 15 or 20%. ∗ P < 0.001 vs. control; # P = 0.0027 vs. 15%-Stat. (d) Nonstimulated controls (n = 6) or BEAS2B cells subjected to strain (n = 3) resembling conventional ventilation without (Vent-like) or with flow-controlled ventilation (Vent+FLEX-like). Box plots indicate median, upper/lower quartile, and bars with minimal/maximal values (or median and range for n = 3). Statistics: analysis of variance (Tukey's post hoc test). ∗ P < 0.001 vs. control; # P < 0.001 vs. Vent-like strain profile. Bars indicate mean ± SD. All strain profiles are presented in more detailed manner in supplementary figures S1-S3.

