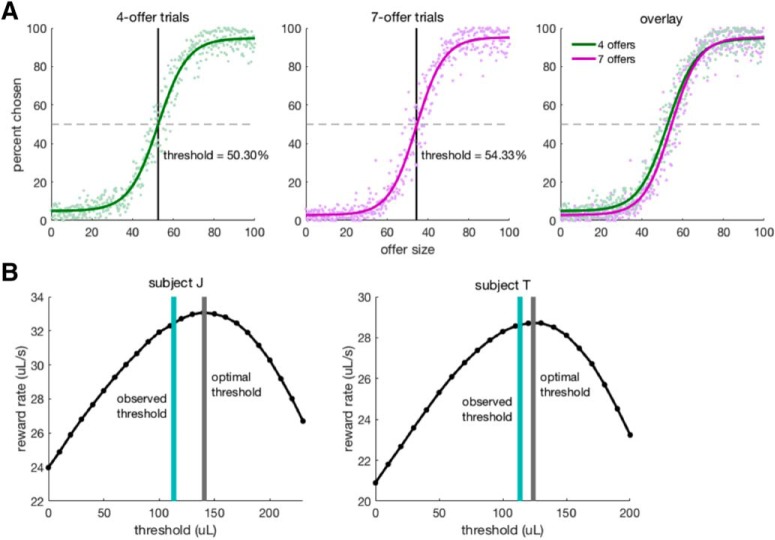
Figure 2.
Subjects' behavior. A, Likelihood of accepting a given option was an approximately sigmoidal function of its value. Observed threshold was slightly higher on 7 option trials than on 4 option trials. Right, Overlay of the two plots. Points represent the percentage of times a particular value was selected out of the times it was encountered. Curves are sigmoidal best fits to these points. B, Optimal behavioral threshold results from computer simulation of task. Black line indicates the average reward rate earned >100 simulations of 1000 trial task sessions for each threshold between 0 and each subject's reward maximum (Subject J: 230 μl; Subject T: 200 μl) in steps of 10 μl. Gray bars represent the threshold that yielded the highest reward rate in the simulation. Teal bars represent the subjects' observed behavioral threshold. For both subjects, observed threshold was significantly lower than optimal, although in both cases, due to the asymmetry of the curve, provided nearly the same intake as the optimal threshold.

