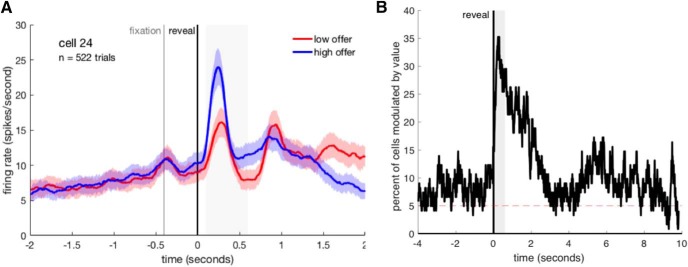
Figure 3.
Encoding of value in vmPFC. A, PSTH showing the firing rate of an example neuron aligned to offers and separated by high and low offer values. For this cell, the firing rate is higher when the offer is high (>50% of maximum value per offer). Colored shading represents SE of firing rate at each time point (10 ms bins). Solid line indicates mean firing and is smoothed >20 bins. Gray shading represents the analysis epoch. Vertical lines indicate the beginning of diamond fixation (400 ms) and the subsequent reveal of the offer. B, Proportion of neurons in our entire sample whose firing rate responses were affected by reward value as a function of time relative to offer period. The x axis is different from A. Proportions are calculated with a 200 ms sliding boxcar. The peak at ∼6 s after offer reveal corresponds to the approximate beginning of the following trial, during which we see a reactivation of encoding of the current offer (consistent with our finding that neurons encode the value of the outcome of the previous trial; see Results). Gray shading represents analysis epoch.

