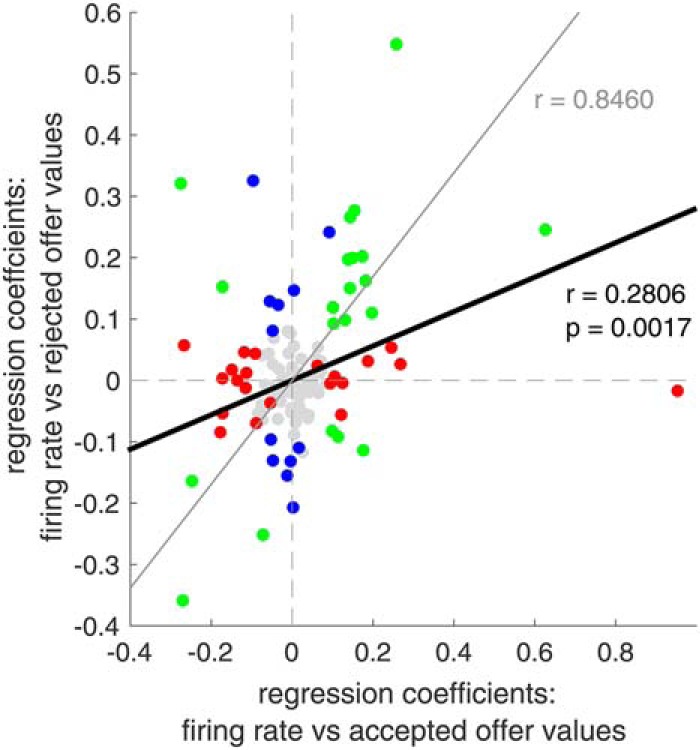
Figure 5.

Population encoding for accepted versus rejected offers. Correlation between regression coefficients for accepted offers and rejected offers (black line, r = 0.2806) falls between 0 (x axis) and the perfectly correlated value, accounting for noise (gray line, r = 0.8460).
