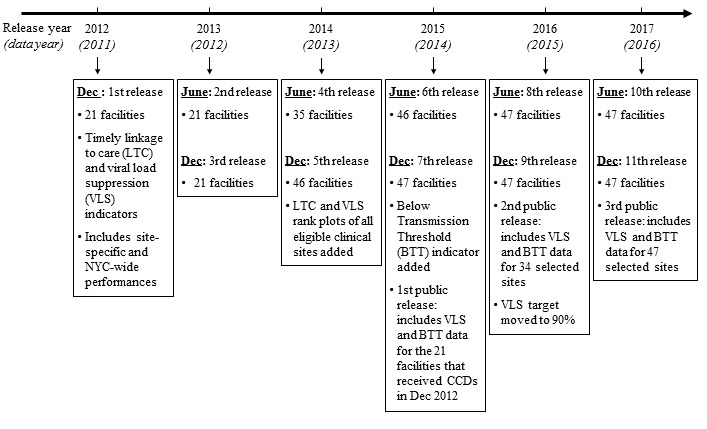
Figure 3.

New York City (NYC) human immunodeficiency virus care continuum dashboards (CCDs) release timeline, 2012-2017. CCD releases are generated using data from a previous 12-month period to ensure completeness of the data (eg, the December 2012 release included data for January-December 2011; the June 2013 release included data for July 2011-June 2012, and so on). LTC: linkage to care; VLS: viral load suppression; BTT: below transmission threshold.
