Fig. 1.

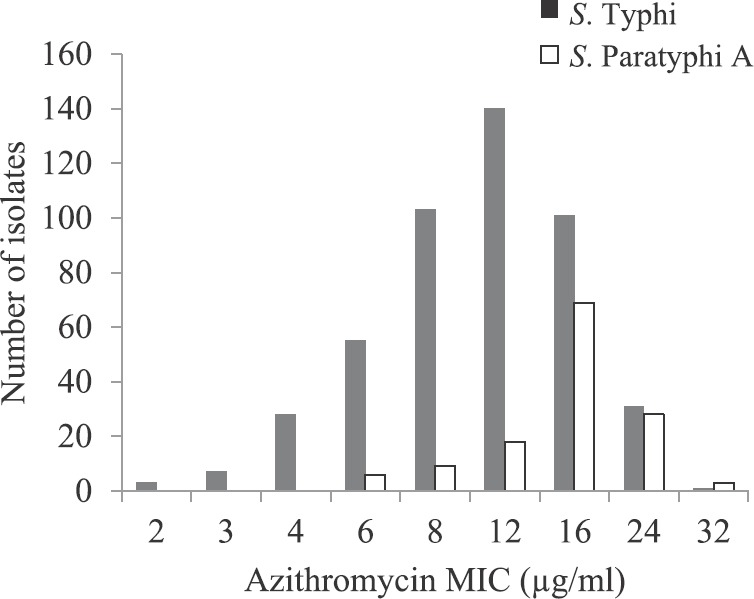
Frequency histogram for azithromycin minimum inhibitory concentration (MIC) in Salmonella Typhi and S. Paratyphi A; distribution curve is skewed towards right for S. Paratyphi A.

Frequency histogram for azithromycin minimum inhibitory concentration (MIC) in Salmonella Typhi and S. Paratyphi A; distribution curve is skewed towards right for S. Paratyphi A.