
Fig. 2.
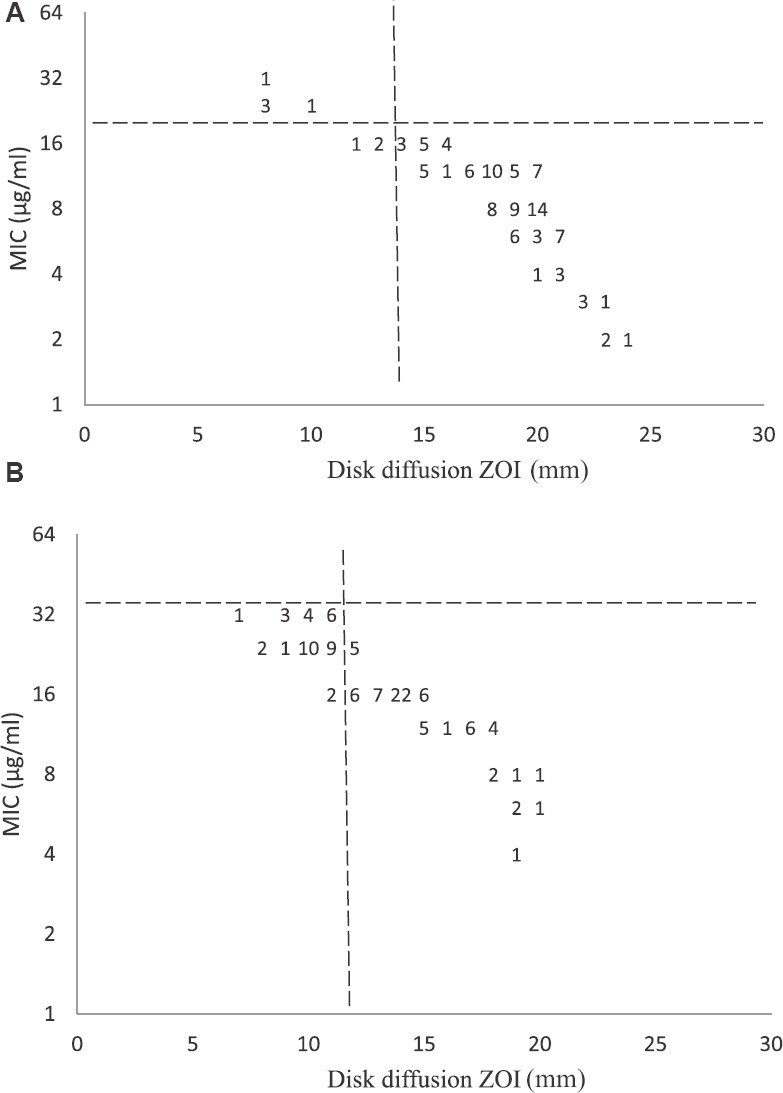
(A). Scatterplot of azithromycin minimum inhibitory concentration (MIC) vs. zone diameter (zone of inhibition, ZOI) for 469 isolates of Salmonella Typhi showing concordance between Clinical and Laboratory Standards Institute (CLSI) breakpoint (ZOI ≥14 mm and MIC ≤16 μl/ml) and determined epidemiological cut-off MIC ≤16 μl/ml), (B). Scatterplot of azithromycin MIC vs. zone diameter for S. paratyphi A, showing lower zone diameter and higher MICdistribution than S. Typhi. Both plots show the relationship between the MIC to azithromycin (y-axis) and the inhibition zone diameters (x-axis). The dotted line denotes the cut-off for susceptible/resistant as per CLSI, 201517.