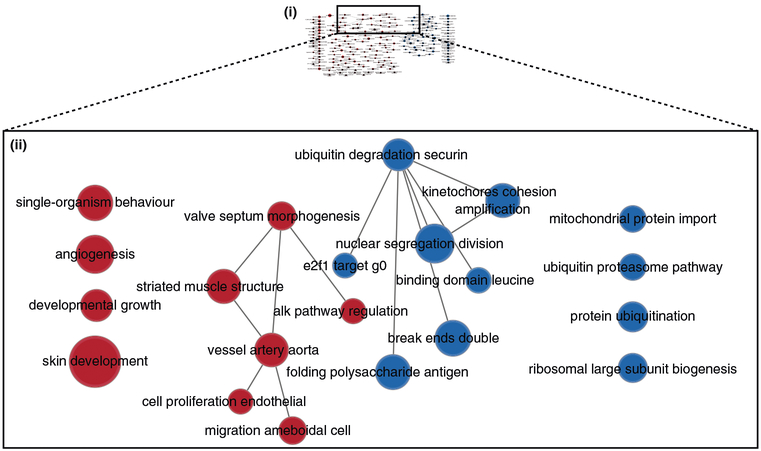
Fig. 11 |. Collapsed enrichment map.
The enrichment map was summarized by collapsing node clusters using the AutoAnnotate application. Each cluster of nodes in Fig. 10 is now represented as a single node. The network was scaled for better node distribution and manually adjusted to reduce node and label overlap. (i) Overall thumbnail view of the entire collapsed enrichment map. (ii) Zoomed-in section of the publication-ready collapsed enrichment map that corresponds to the zoomed-in network in Fig. 10 (ii).

