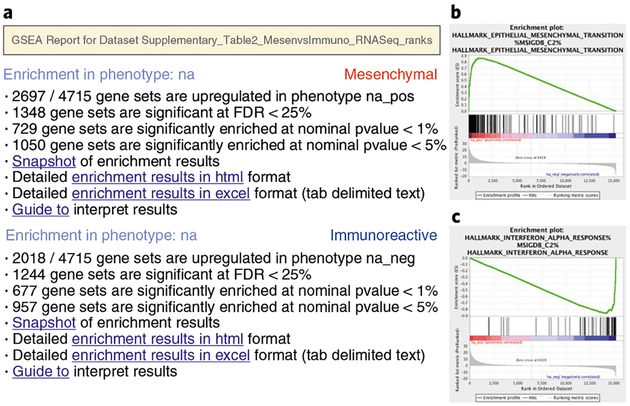
Fig. 4 |. GSEA output overview.
a, Web page summary of GSEA results showing pathways enriched in the top or bottom of the ranked list, with the ‘na_pos’ and ‘na_neg’ phenotypes corresponding to enrichment in upregulated and downregulated genes, respectively. These have been manually labeled here as mesenchymal and immunoreactive, respectively. Clicking on ‘Snapshot’ under either of the phenotypes will show the top 20 enrichment plots for that phenotype. b, An example enrichment plot for the top pathway in the mesenchymal set. c, An example enrichment plot for the top pathway in the immunoreactive set.

