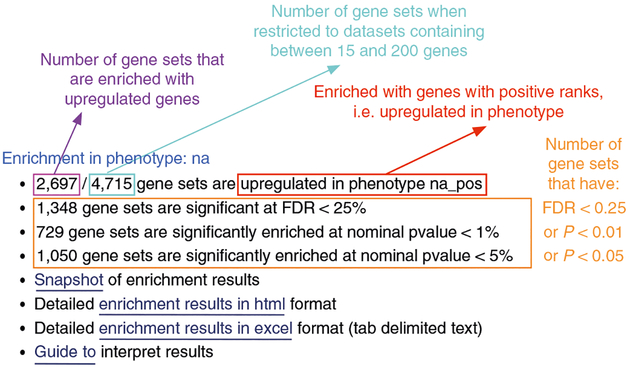
Fig. 5 |. Class/phenotype-specific GSEA output.
Class/phenotype-specific GSEA output in the web page summary shows how many gene sets were found enriched in upregulated genes, regardless of significance (purple), the total number of gene sets used after size filtering (cyan), the phenotype name (red) and the number of gene sets that pass different thresholds (orange).

