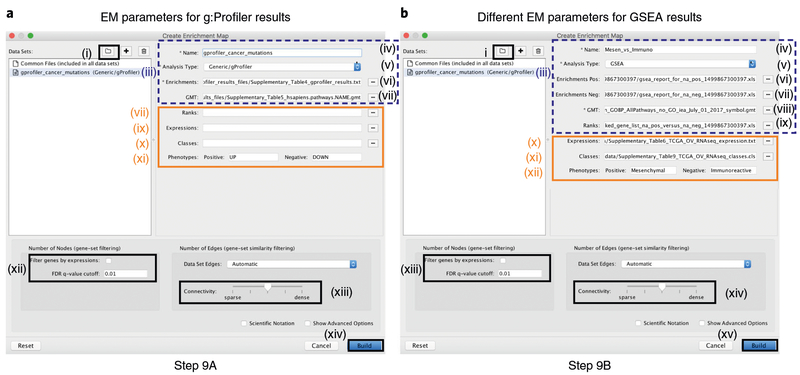
Fig. 6 |. Screenshot of the EnrichmentMap software user interface.
a,b, Input fields in the EnrichmentMap interface for g:Profiler (a) and GSEA (b) results. Procedural steps are shown for Step 9A and 9B. Other than the specific input files, the parameters are the same for the two analysis types. Attributes surrounded by a dashed box should be filled out automatically if the user selects an appropriate folder with the required files. Missing file names indicate that EnrichmentMap was unable to find the specified file. Orange boxes indicate optional files. For the examples presented in the protocol, optional files are used for the GSEA analysis but not for the g:Profiler analysis to demonstrate the two distinct use cases. EM, EnrichmentMap.

