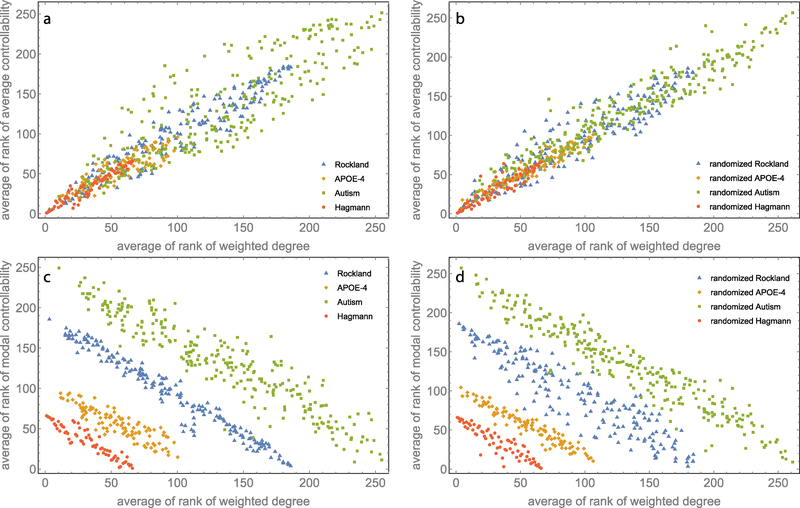
Figure 2:
Comparing controllability measures between empirical data and randomized data. Scatter plot of the average of the ranks for weighted degrees versus average of the ranks of the average controllability for (a) the empirical data and (b) their randomized counterpart. Scatter plot of the average of ranks for weighted degrees versus the average of ranks of the modal controllability for (c) empirical data and (d) their randomized counterpart.

