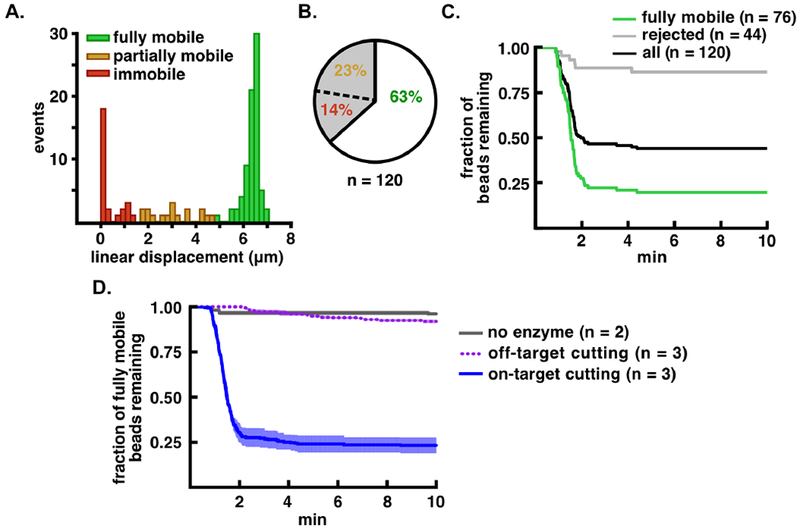
Figure 4.

Improved analysis of TEV-catalyzed proteolysis using computational sorting of bead mobility. A. Distribution of flow extension distances for bead-tethered, TEV substrate molecules. The fully mobile population is shown in green, partially mobile in orange, and immobile in red. B. Pie chart showing the percentage of accepted, partially mobile, and immobile beads in the tethered population. C. Proteolysis of bead-tethered substrates upon addition of 20 μM TEV protease. The fraction of beads lost is plotted as a function of time for the total population (black), the accepted (fully mobile) population (green), and the rejected population (gray). D. Cleavage specificity analysis. Bead release from cleavage of the tethered peptide substrate is indicated with a blue solid line, release of the tethered all-DNA substrate is indicated with a purple dotted line, and bead release in the absence of enzyme is indicated in gray. Kinetic traces are normalized such that t = 0 min is set to 1 min before the start of bead loss, and are shown as mean ± S.E.M. for the number of trials indicated (n = 2 or n = 3).
