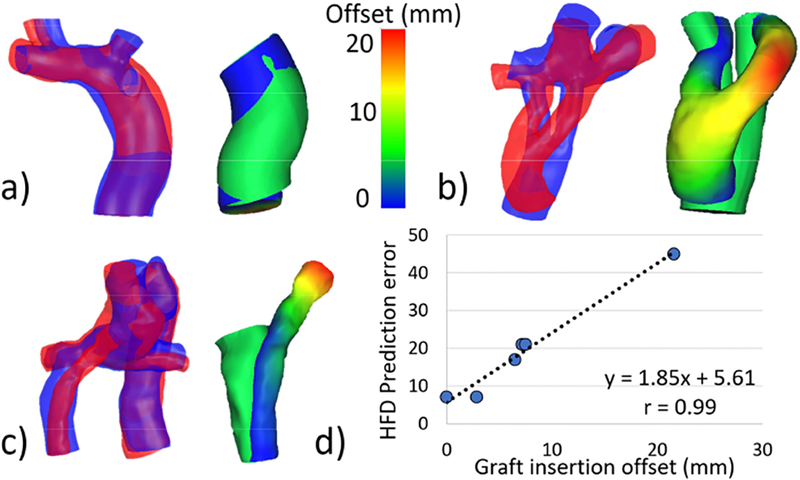
Figure 4:

Relationship between hepatic flow distribution (HFD) prediction error and graft insertion offset for extracardiac conduit and Y-graft Fontan connections. Graft insertion offset describes the distance between the predicted and implemented graft insertion locations. Representative cases are shown for (a) low, (b) moderate, and (c) high graft insertion offsets. A strong correlation (d) was seen between prediction error and offset for these connection types. The overlay figures (panels a-c) compare the predicted (blue) and post-operative (red) TCPCs on the left, and show a colormap of the offset between the predicted and post-operative grafts on the right for each representative case. All cases use the same color scale. TCPC: total cavopulmonary connection.
