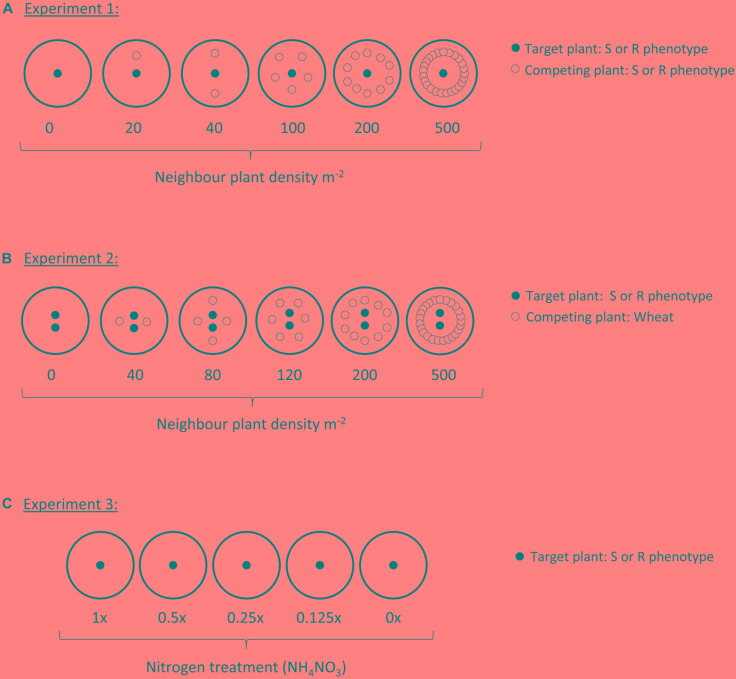
FIGURE 1.
Diagram of planting designs within each of the three experiments. Each large circle represents a single pot, either filled with a Kettering loam soil (Experiments 1 and 2), or sand (Experiment 3). Small black-filled circles represent the target plant, always either an R or S blackgrass phenotype. Small hollow circles in Experiments 1 and 2 show the position of neighbor plants, either R or S phenotypes of blackgrass (Experiment 1), or wheat (Experiment 2).

