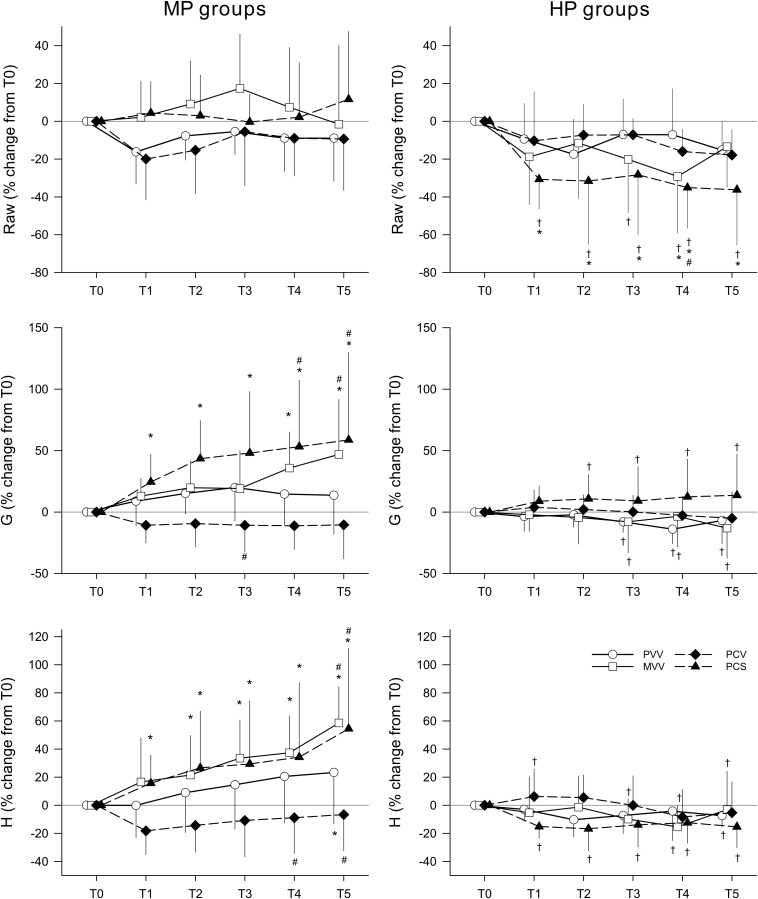
FIGURE 2.
Changes in respiratory mechanical parameters during the application of various ventilation modes compared to values obtained before application (T0). Left panels display changes in groups ventilated with a PEEP of 6 cmH2O, whereas groups depicted in the right panels were ventilated with a PEEP of 9 cmH2O. Data are presented as group means ± half-width of 95% confidence interval. Raw, airway resistance; G, tissue damping; H, tissue elastance; T1–T5, measurement points at the end of each 5 h of ventilation with an experimental pattern; MP, moderate PEEP; HP, high PEEP; PVV, physiological variable ventilation; MVV, mathematical variable ventilation; PCV, pressure-controlled ventilation; PCS, pressure-controlled ventilation with regular sighs. Results of the ANOVA analyses (p-values) for factor “ventilation mode.” p = 0.44 for Raw, p < 0.01 for G and p = 0.02 for H; for factor “PEEP.” p < 0.01 for all variables; for the interaction of “ventilation mode *PEEP p < 0.01 for all variables; for interaction of “ventilation mode * PEEP * time.” p < 0.01 for all variables. *p < 0.05 vs. T0. #p < 0.05 vs. PVV. †p < 0.05 vs. MP.

