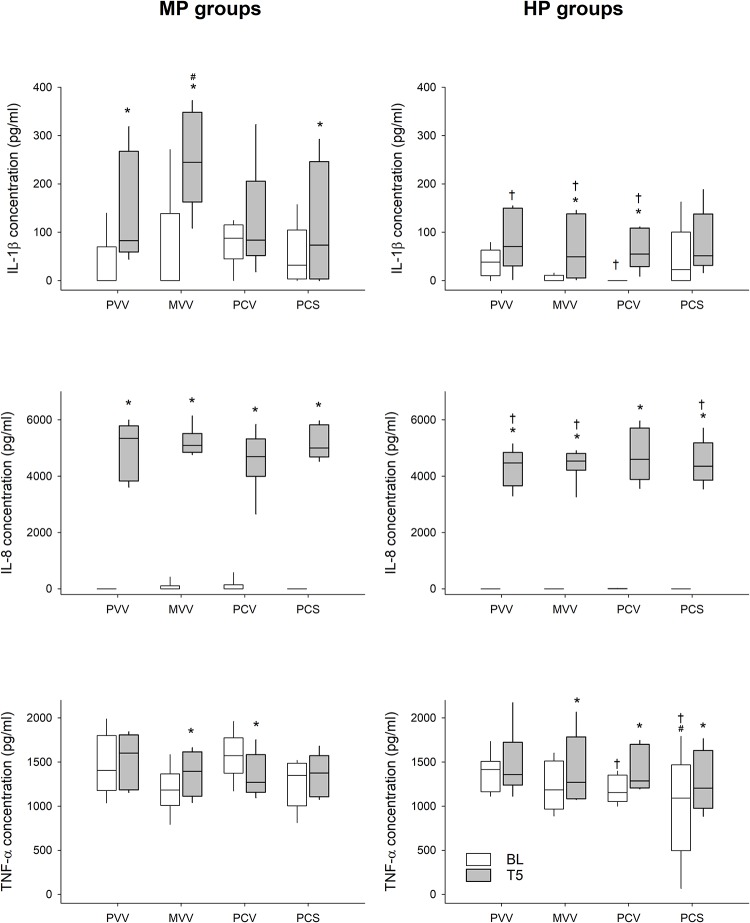
FIGURE 5.
Changes in inflammatory cytokine levels during the application of various ventilation modes compared to values obtained at the beginning of the experiment (BL). Left panels display changes in groups ventilated with a PEEP of 6 cmH2O, whereas groups depicted in the right panels were ventilated with a PEEP of 9 cmH2O. PVV, physiological variable ventilation. MVV, mathematical variable ventilation. PCV, pressure-controlled ventilation. PCS, pressure-controlled ventilation with regular sighs. Results of the ANOVA analyses (p-values) for factor “ventilation mode”: p = 0.35 for IL-1β, p = 0.14 for IL-8, p < 0.01 for TNF-α; for factor “PEEP”: p < 0.01 for all variables; for the interaction of “ventilation mode * PEEP”: p = 0.01 for IL-1β, p = 0.18 for IL-8 and TNF-α; for interaction of “ventilation mode * PEEP * time”: p < 0.01 for IL-1β, p = 0.04 for IL-8 and TNF-α. *p < 0.05 vs. BL. #p < 0.05 vs. PVV. †p < 0.05 vs. MP.

