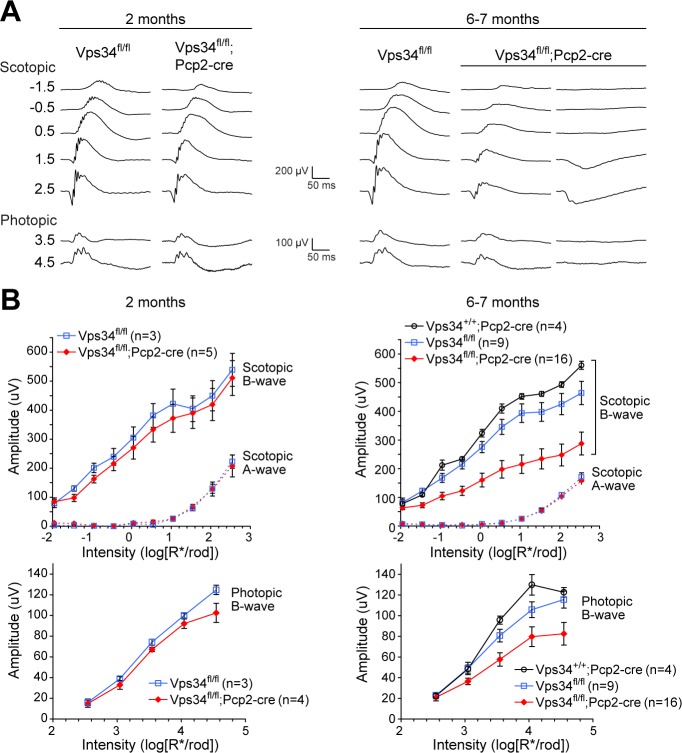
Figure 5.
Loss of BC-driven b-wave responses. (A) Example recordings from control or Vps34fl/fl;Pcp2-Cre KO mice at 2 months (left) or 6 to 7 months (right). Examples from two 6- to 7-month KO mice are shown to illustrate the variability among animals. (B) Aggregate a- and b-wave amplitudes. Amplitudes of b-waves were significantly smaller in the KO at 6 to 7 months, while a-waves were unchanged. Points and error bars represent means ± SEM, and the number of mice for each genotype is indicated in parentheses. To determine whether control and KO b-wave amplitudes are significantly different, best-fit intensity-response curves were generated separately for b-wave data from Vps34fl/fl and Vps34fl/fl;Pcp2-Cre animals. This model was compared to the null hypothesis model (a curve fit to combined Vps34fl/fl and Vps34fl/fl;Pcp2-Cre data) using an F test, yielding P < 0.001 for both scotopic and photopic b-waves.

