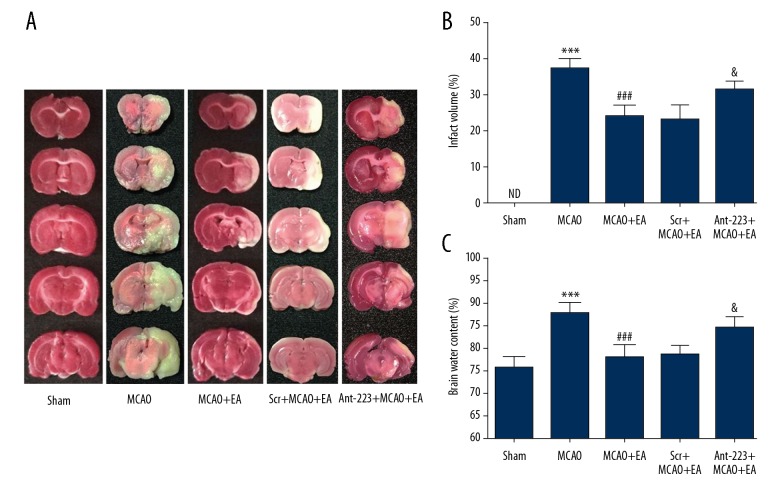
Figure 3.
EA treatment reduces the brain infarct volume and alleviates cerebral edema upon MCAO. (A) Representative micrographs of TTC-stained brain sections in the 5 groups. (B) Infarct volume quantitation. (C) Brain water content quantitation (n=5, and error bars represent mean ±SD. *** P<0.001, vs. the Sham group; ### P<0.001, vs. the MCAO group; & P<0.05, vs. the EA +MCAO group). ND – not detected.

