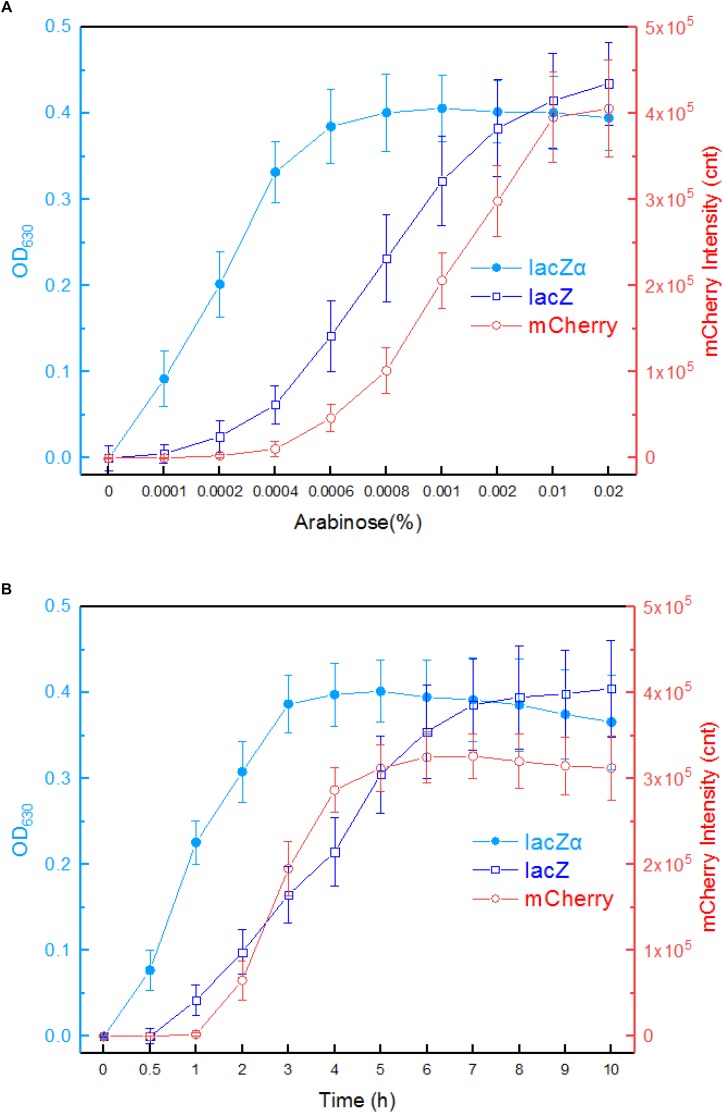
FIGURE 4.
Comparison of the ara promoter activities in response to arabinose in lacZα, lacZ, and mCherry reporter systems. (A) Response curves of Top10/pPara-lacZα, Top10/pPara-lacZ, and Top10/pPara-RFP to different concentrations of arabinose. Recombinant E. coli was induced with 0–0.02% arabinose plus 0.1 mM IPTG at 37°C. Then, β-galactosidase activity and mCherry fluorescent signal of induced cultures were determined at 8 h. (B) Time courses of reporter signals in recombinant Top10/pPara-lacZα, Top10/pPara-lacZ, and Top10/pPara-RFP treated with 0.002% arabinose. After recombinant E. coli was induced with 0.002% arabinose plus 0.1 mM IPTG, β-galactosidase activity and mCherry fluorescent signal of induced cultures were determined at regular time intervals. The data are representative of three independent experiments, and expressed as mean ± SEM. The optical density at 630 nm and mCherry fluorescence intensity were all normalized by the OD600 value of the induced culture.

