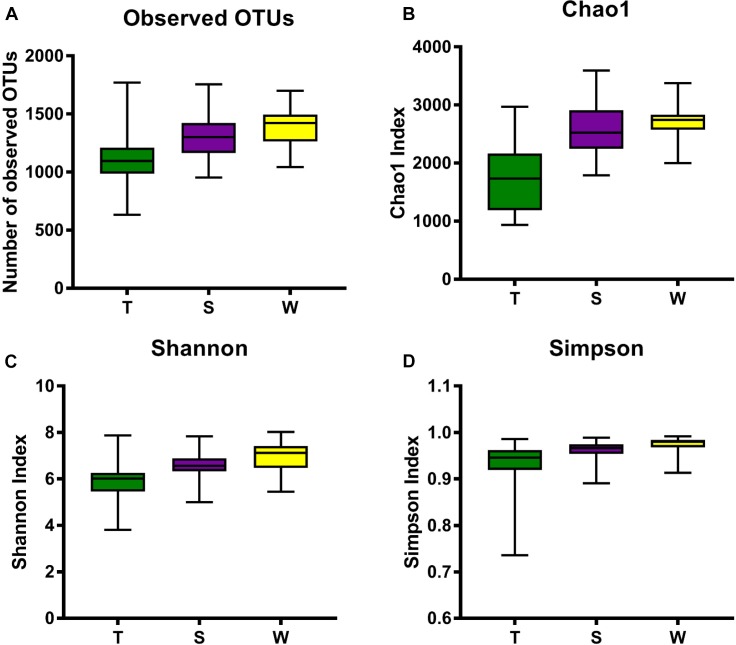
FIGURE 2.
Alpha diversity analysis against all three groups. Box plots of Observed OTUs (A), Simpson index (B), Shannon’s index (C) and Chao 1 index (D) are shown. The indexes of groups S and W were higher than group T from the four plots, indicating that the S group and W group had higher alpha diversity than the T group.

