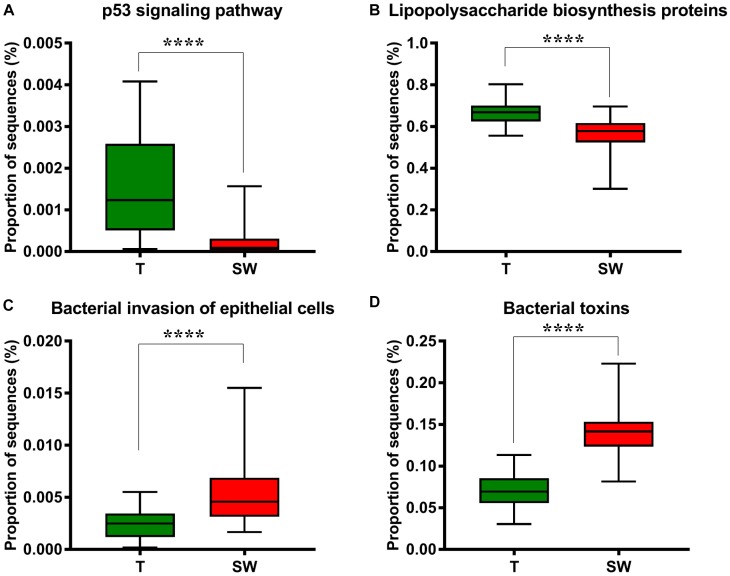
FIGURE 5.
Box plot showing the significantly different KEGG items between group T and groups S and W. Group T had a higher proportion of sequences in TP53 pathways (A) and lipopolysaccharide biosynthesis proteins (B); Groups S and W had a higher proportion of sequences in bacterial invasion of epithelial cells (C) and bacterial toxins (D).

